By Brian Sears
6 November 2015
There is a strong relationship in the Premier League between goals scored and points accrued. It’s not always the case that a goal is worth a point, and certainly there will be outlier teams who score more goals than they amass points, and vice versa.
But across the league as a whole over multiple years, the general rule is that a goal is worth roughly a point. In 2011-12, for example, there were 1,066 goals and 1,047 points, or 0.98 points per goal; in 2012-13 there were 1,063 goals and 1,032 points, at 0.97 points per goal; in 2013-14 there were 1,052 goals and 1,062 points for 1.01 points per goal and last season there were a low 975 goals and 1,047 points for 1.07 points per goal.
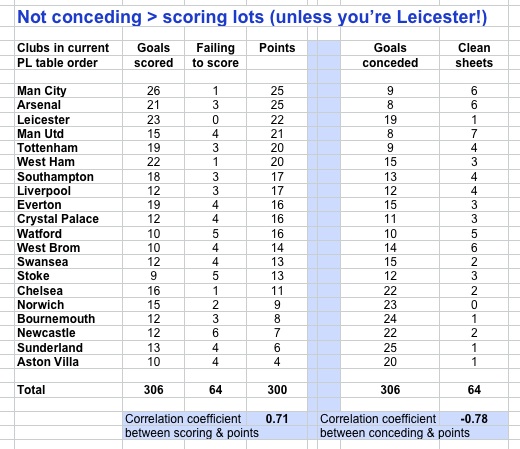
This season each club has played 11 games (that means 29 per cent of the season is gone), and exactly 300 points have been won collectively by the teams, and 306 goals scored, at a rate of 1.02 points per goal. And the points gained by each club are indeed positively related to the goals scored. The four clubs who have each scored more than 20 goals all start this weekend’s action in the top six positions with 20 or more points. Manchester United (15 goals) and Tottenham (19) are in the top six without managing 20 goals.
The statistical correlation coefficient, or in laymen’s terms, the strength of the relationship between goals scored and points gained, is a positive 0.71. (A figure of 0 would mean no relationship, a value of up to 0.3 would denote a weak relationship; 0.3 to 0.5 would denote a moderate relationship, so a 0.71 is a strong statistical relationship).
And yet. There’s an even stronger correlation between points gained and goals conceded. Or rather points gained and goals not conceded. Statistically this turns out to be -0.78 (negative, as the fewer goals conceded leads to more points gained.) Thus four clubs out of the top five have not yet allowed the total of goals conceded to reach double figures but the bottom six clubs are the only ones to have conceded 20 or more goals.
The exception that proves the rule is Leicester. They’re proudly third in the Premier League but 13 clubs have let in fewer goals. And Leicester have only one clean sheet to their name so far this season (home to Crystal Palace). That’s the same as Bournemouth, Sunderland and Aston Villa. Norwich have yet to register a clean sheet.
Leicester, however are the only Premier League side to have scored in all 11 games played. Newcastle have drawn a blank in over half their games played. United are currently are the clean sheet maestros (big cheer for LVG, big boo from the fans who want attack, attach, attack), closely followed by Manchester City, Arsenal and West Brom.
Article continues below
.
And another thing …
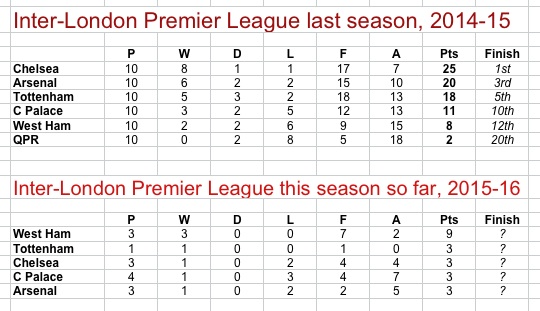
Last season’s games played between the capital’s six clubs produced a mini-league table that had a predictable look about it, with the ‘big’ teams doing best and the smaller teams doing worse. And as you can see below, the order they finished in the inter-London league was also the order they finished (among themselves) in the final Premier League table.
This season’s embryonic table after seven of the 20 inter-London games have been played is one that few would have predicted.
Chelsea and Arsenal have already lost as many or more London derbies than they lost all of last season. West Ham, having only played three games, have more points than they gained all of last season.
Tottenham have already gained a 1-0 win over Palace and they now embark on three consecutive London derbies: away to Arsenal on Sunday and then at home to West Ham and then Chelsea on the last two Sundays of November. What will the inter-London table look like after those three games? We don’t know, obviously. Which is the beauty of things.
.
…. And finally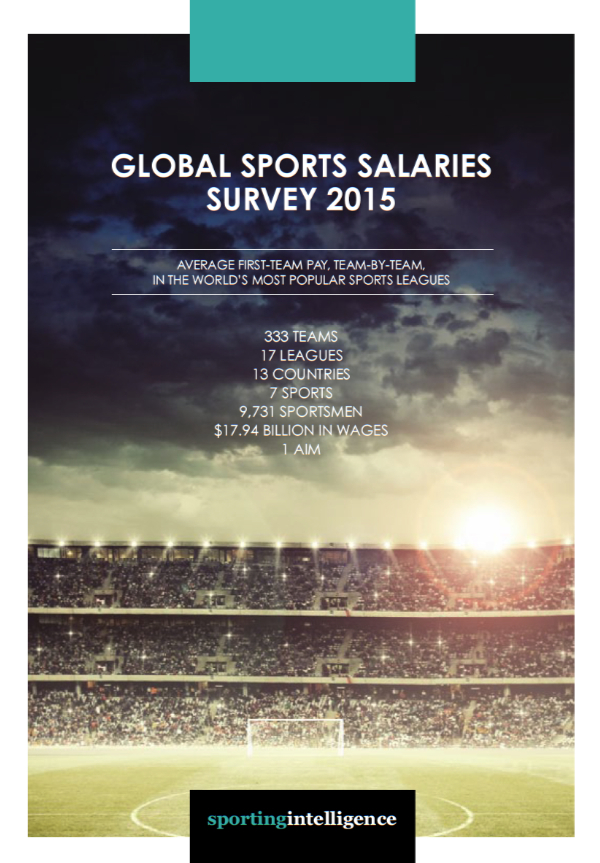
The statistics in these pages will often be in relation to the Premier League era when they deal with English football. We know the game is a bit older than that. We know Preston won as Invincibles in the league’s first season in 1888-89. But the Premier League is a distinct era if only because of the money that has transformed the picture. This is the ‘monied era’.
To get some idea of how the financial situations of these clubs have changed over time – and finance is a big influence in success in football – further reading and related articles spring from Sportingintelligence’s annual global sports salaries reports, are linked here. The 2015 edition of the report (right) was published in May.
You can download a free 120-page PDF here.
2014 Report 2013 Report 2012 Report 2011 Report 2010 Report
.
More on Arsenal / Liverpool / Man Utd (or search for anything else in box at top right)