
Salaries report
FOR GSSS reports since 2014, visit https://www.globalsportssalaries.com/
Sportingintelligence’s Global Sports Salary Survey 2014
Obtain the full report free from 15 April 2014 by clicking this link to send an email. (Write GSSS 2014 in the subject line, and your name / organisation in the email). Or download it directly from the GSSS microsite: http://www.globalsportssalaries.com/
———————-
Sportingintelligence’s Global Sports Salary Survey 2013..
 This 18-page PDF report (free extract here: GSSS 2013 extract) is accompanied with supporting materials in a sortable spreadsheet. Extra information in the spreadsheet includes location and map link for each featured team, stadium or arena name and capacity and locational co-ordinates. This allows the user to re-organise the data by league, location and capacity as well as by average pay.
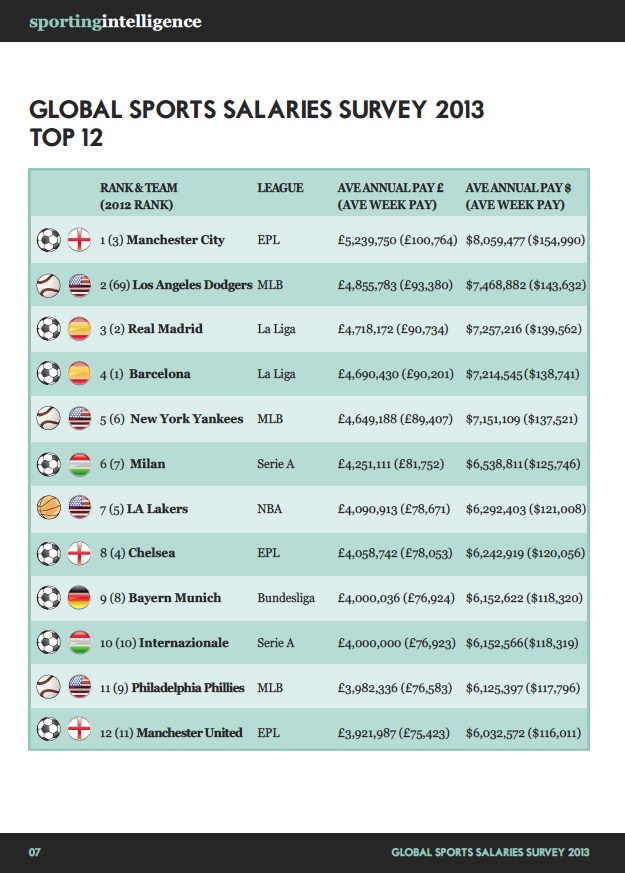
The package, comprising the PDF and spreadsheet, costs £14.99. The PDF contains introductory analysis about the world’s best-paid sports teams; a full list of average first-team pay at 278 teams from 14 leagues in 10 countries from seven sports, ranked by average first-team pay; and a summary of pay across each league as a whole.
When you order, the PDF and supplementary XLS spreadsheet will automatically be sent to your nominated email account.
The unique metric used in this survey is ‘average first-team pay’. Lists of individual players’ earnings are not included.
NB: Some but not all of the information / data in the report / supporting materials is available on this website or may be in the future within articles illustrating considering different aspects of pay and performance in global sport.
..
![]()
———————-
Sportingintelligence’s Global Sports Salary Survey 2012
.
Available for email dispatch from 2 May 2012, this 18-page PDF report, costing £9.99, contains introductory analysis about the world’s best-paid sports teams; a full list of 278 teams from 14 leagues in 10 countries from seven sports, ranked by average first-team pay; and a summary of pay across each league as a whole.
NB: Some but not all of the information / data in the report is or will be available on this website at different points in the future within articles illustrating considering different aspects of pay and performance in global sport.
NOTE: This report will only be dispatched after 2 May 2012, to one nominated email address per purchaser. Orders will be individually processed during working hours, UK time. At certain periods, there may be a day or two delay in dispatching of reports.
.
.

![]()
..
———————-
Sportingintelligence’s Global Sports Salary Survey 2011
.
The 2011 report is no longer on general sale.
.
 .
.
———————————
The 78-page Global Sports Salaries Survey 2011 compares average first-team earnings at 272 teams in 14 leagues in 7 sports in 10 counties across the world. Those 14 leagues are the NBA (basketball), IPL (cricket), MLB (baseball), Premier League (English football), NFL (US gridiron), NHL (ice hockey), Bundesliga (German football), Serie A (Italian football), La Liga (Spanish football), NPB (Japanese baseball), SPL (Scottish football), AFL (Aussie Rules football), MLS (American soccer) and CFL (Canadian gridiron).
The first section of the report is a league table of average pay, with the 272 featured teams ranked No1 to No272. The 2011 report was compiled in association with ESPN The Magazine in America, and the rankings list in the report was compiled specifically for the magazine’s edition on 2 May 2011, a special ‘All About the Money’ issue. As such, the main list, which runs over eight pages, is comprised of the latest information available for each league at the compilation date.
Specifically it features data from the 2011 MLB season, the 2010-11 NFL, NBA and NHL seasons, the 2010 seasons for the IPL, NPB, AFL, MLS and CFL, and the most recent available data at the compilation cut-off date for the other football leagues, most recently from the 2009-10 season. This report does not contain any football (soccer) data from the 2010-11 season because it was not available to us, nor does it contain any information about any individual’s pay in any sports aside from prize money earnings for a selected list of elite tennis players and golfers.
The main body of the report, a 56-page section that devotes four pages of detail and analysis to each of the 14 leagues, considers the relationship between pay and performance in each of those leagues. In order to assess this properly, we needed the seasons in question a) to have been completed; and b) to have a full set of data for all the teams in the those leagues for a season. So this section carries data that is, for some leagues, different – ie: additional to – the data used for the main rankings list.
Specifically for pay v performance purposes, the report considers the 2009-10 season for the NBA and NHL, the 2010 seasons for the IPL, NPB, AFL, MLS and CFL, the 2010 season (ending in the 2011 Super Bowl) for the NFL, and the 2008-09 season for the Premier League, Bundesliga, Serie A, La Liga and SPL. There is a natural ‘data lag’ for European football clubs where the ‘raw material’ data comes from annual accounts that are often only available as much as a year after the end of the previous season. For some clubs we had the 2009-10 data in time to include that data in the main list.
The league-by-league analysis comprises, for each league: A) a table of average first-team pay per team, ranked in order from top to bottom payers; B) a summary of what happened on the field / court /pitch that season, either in the form of a final league table, and / or regular season summary plus details of the postseason / play-offs; C) Performance indicators showing how the best paid sections of the leagues and the worst paid sections fared over the seasons; D) a wage distribution graph per league; E) a short analysis of the ‘spread of success’ over a 10-year period in the league, aside from in the IPL, which had only had three seasons by the end of 2010; F) a pay versus performance graph and short analysis for each league in the season in question, ranking each team’s position by pay against their finishing position in the season.
After the league-by-league section, there is a concise two-page summary of the 14 leagues providing the average salary figure per whole league, and the ratio between the best paid and worst paid teams in each league for the ‘analysis’ season.
There are two pages dedicated to tennis players (top 10 men and top 10 women) and golfers (top 20 men) by on-court (on-course) prize earnings in 2010, and where they would rank if they were in the teams list.
The report finishes with a table of the average attendances per game in the 14 leagues considered in the report. Twelve of those leagues are the 12 best-attended domestic professional sports leagues in the world, which is why they were chosen to feature in the report in the first place.
If you are interested in the headline figures and a general snapshot of pay, then its quite possible you won’t need anything other than the freely available (and free) information already carried on this website and in ESPN The Magazine, either in the hard copy or online. We will also carry features on this website that draw upon the findings in the report, without using all of them.
.
———————————
.
The 2010 report, published on 2 April 2010, is no longer available for purchase.
.

.
——
The most recent completed season was used in each case where the full data set of information for all teams was available at the compilation cut-off point, the end of 2009. So while we know some newer figures for some teams in some sports, only “whole league” data is included in the report; the review’s major aim, aside from trying to find a comparison in pay between sports, is to consider how pay affects performance. For that, whole data sets are needed for each league, and seasons need to have been completed. Note: a conversion rate of $1 = £0.61 was used for all dollar-to-pound calculations in this report.
The report’s contents are as follows: introduction; list of 211 teams featured in order of calculated average pay per player per team, per year and per week; summary of average pay per league including ratio between the highest average and lowest average within each league; a 4-page summary of pay and basic analysis of pay and performance for each of the 10 featured leagues; prize money earnings for the world’s top 10 male and female tennis players in 2009, and the world’s top 10 golfers in 2009, to illustrate how major solo sports compare; and a table of the world’s best-attended domestic sports leagues, by average attendance per game.
.
..
.


4 comments
NFL has ‘fairest’ pay distribution among the world’s major sports leagues « Sporting Intelligence
Canadiens back at top of attendance charts as NHL crowds dip by two per cent « Sporting Intelligence
EXCLUSIVE EXTRACTS: Portsmouth’s debts laid bare in administrator’s bombshell report « Sporting Intelligence
Cavaliers on rise against Bulls in attendance race (as well as play-offs) as NBA weathers downturn « Sporting Intelligence