*
The final whistle in the Germany-Portugal match in Group G in Salvador marked the end of the 12th game of the 2014 World Cup, and thus a quarter of the group stage is complete. There have been expected victories for some, big upsets for others and more goals per game at this stage than any World Cup since the 1950s. Who could have forecast this? Actually, a huge variety of ‘experts’, forecasters, theorists, modelers and systems have tried to predict the outcome of this tournament. In his debut post for Sportingintelligence, and as part of an ongoing evaluation of rates of success, Roger Pielke Jr sorts the best from the rest.
Follow Roger on Twitter: @RogerPielkeJR and on his blog
.
 By Roger Pielke Jr.
16 June 2014
Prognosticators have been hard at work generating pre-tournament predictions of who will advance and who will win. But which prediction is the best? Is it the one who picks the winner? Or is it the one which best anticipates the knock-out round seedings? How can we tell?
I will be evaluating 11 predictions over the course of the World Cup, starting with a league table after 12 games, in a moment. But suffice to say that after a dozen games, Fifa’s ranking system is proving as good as any other indicator of success, while some eminent thinkers are faring less well.
The 11 under consideration are:
- Goldman Sachs
- FIFA World Rankings
- Elo Rankings
- Infostrada
- Hassan and Jimenez
- Danske Bank
- Bloomberg
- Andrew Yuan via The Economist
- Betfair.com odds (on June 5, 2014 courtesy of Roddy Campbell)
- FiveThirtyEight
- Financial Times
To evaluate the different predictions, I am going to quantify the “skill” of each forecast. It is important to understand that forecast evaluation can be done, literally, in an infinite number of ways. Methodological choices must be made and different approaches may lead to different results. Below I’ll spell out the choices that I’ve made and provide links to all the data.
A first thing to understand is that “skill” is a technical term which refers to how much a forecast improves upon what is called a “naive baseline,” another technical term. (I went into more detail on this at FiveThirtyEight earlier this spring). A naive baseline is essentially a simple prediction. For example, in forecast evaluation meteorologists use climatology as a naive baseline and mutual fund managers use the S&P 500 Index. The choice of which naive baseline to use can be the subject of debate, not least because it can set a low or a high bar for showing skill.
The naive baseline I have chosen to use in this exercise is the transfer market value of the 23-man World Cup teams from Transfermarkt.com. In an ideal world I would use the current club team salaries of each player in the tournament, but these just aren’t publicly available. So I’m using the next best thing.
So for example, Lionel Messi, who plays his club team football at Barcelona and his international football for Argentina, is the world’s most valuable player. His rights have never been sold, as he has been with Barcelona since he was a child, yet he’s estimated to have a transfer market value of more than $200 million. By contrast all 23 men on the USA World Cup squad have a combined estimated value of $100 million. (I have all these data by player and team if you have any questions about them — they are pretty interesting on their own.)
Here then are the estimated transfer values of each World Cup team:
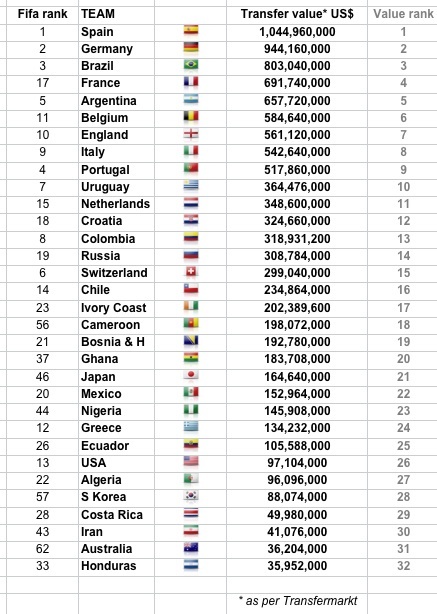
.
In using these numbers, my naive assumption is that the higher valued team will beat a lower valued team. As a method of forecasting that leaves a lot to be desired, obviously, as fans of Moneyball will no doubt understand. There is some evidence to suggest that across sports leagues, football has the greatest chance for an underdog to win a match. So in principle, a forecaster using more sophisticated method should be able to beat this naive baseline.
Here is what the naive baseline (based on the team rosters as of June 5) predicts for the Group Stages of the tournament: The final four will see Brazil vs Germany and Spain vs Argentina. Spain wins the tournament, beating most everyone’s favorite Brazil. The USA does not get out of the group stage, but England does. All eight of the top valued teams make it into the final eight.
While this naive baseline is just logic and assumptions, work done by “Soccernomics” authors Stefan Szymanski and Simon Kuper indicates that a football team’s payroll tends to predict where it winds up every year in the league table. Payrolls aren’t the same thing as transfer fees, of course, but they are related. Unfortunately, as mentioned above individual player salaries are not available for most soccer leagues around the world (MLS is a notable exception).
The predictions are not all expressed apples to apples. So to place them on a comparable basis I have made the following choices:
- A team with a higher probability of advancing from the group is assumed to beat a team with lower probability.
- If no group stage advancement probability is given I use the probability of winning the overall tournament in the same manner.
- This means that I have converted probabilities into deterministic forecasts. (There are of course far more sophisticated approaches to probabilistic forecast evaluation.)
- No draws are predicted, as no teams in the group stages have identical probabilities.
- The units here, in the group stage at least, will simply be games predicted correctly. No weightings.
Other choices could of course be made. These are designed to balance simplicity and transparency with a level playing field for the evaluation. Just as is the case with respect to the value of having a diversity of predictions, having a diversity of approaches to forecast evaluation would be instructive. No claim is made here that this is the only or best approach (laying the groundwork here for identifying eventual winners and losers).
With all that as background, below then are the predictions in one table (click on it for a bigger view). The yellow cells indicate the teams that the naive baseline sees advancing to the knockout stages, and the green shows the same for each of the 11 predictions. The numbers show the team rankings according to each prediction.
(Click to enlarge, article continues below)
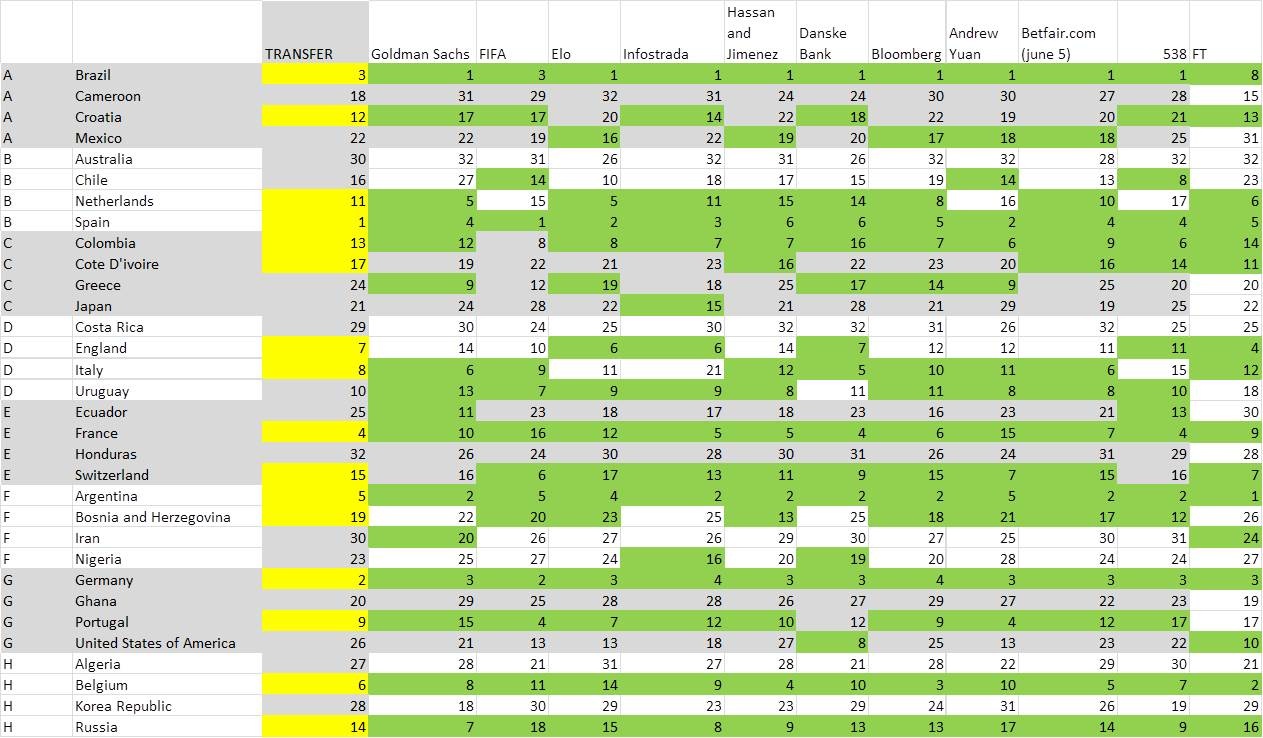
I will be tracking the performance of the 11 predictions against the naive baseline as the tournament unfolds, scoring them in a league table.
After 12 matches, the first league table is below. It is early still in the tournament, but there already is a bit of spread developing among the predictions. Five of the 11 are running ahead of the naive baseline, and four are trailing. But it is only one game in either direction, so I’d hesitate in saying anything much at this point. As the tournament progresses I expect we will see greater divergence. Stay tuned.
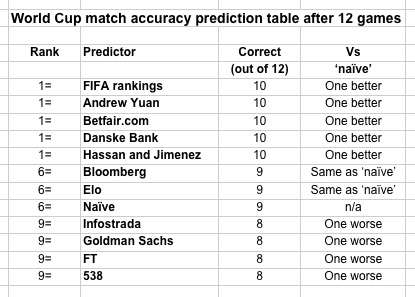
.
Roger Pielke Jr. is a professor of environmental studies at the University of Colorado, where he also directs its Center for Science and technology Policy Research. He studies, teaches and writes about science, innovation, politics and sports. He has written for The New York Times, The Guardian, FiveThirtyEight, and The Wall Street Journal among many other places. He is thrilled to join Sportingintelligence as a regular contributor. Follow Roger on Twitter: @RogerPielkeJR and on his blog
.