Nick Harris
SJA Internet Sports Writer of the Year
30 October 2011
When Everton won the First Division title in 1984-85, a typical XI would have been Southall, Stevens, Van Den Hauwe, Ratcliffe, Mountfield, Reid, Steven, Heath, Sharp, Bracewell and Sheedy, with plenty of appearances as well for some bloke called Andy Gray.
The top scorer in domestic football was a Leciester City striker called Gary Lineker, in his final season with the Foxes before a big money move to Everton. He got 24 First Division goals that season, the same as Chelsea’s Kerry Dixon.
Liverpool were runners-up in the league, followed by Tottenham, Manchester United and those other mid-80s big-punchers, Southampton, with Chelsea and Arsenal tucked in behind in sixth and seventh.
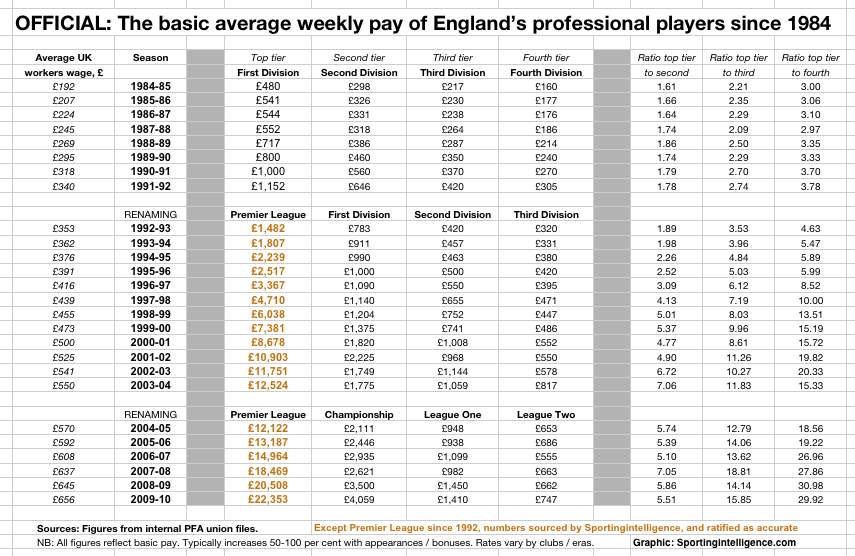
The rewards on offer to top players were obviously decent. Figures published for the first time today show that top division players in England earned a basic average of £480 per week (£25,000 a year), which was more than double what the average worker earned, and which was three times as much as players earned in the Fourth Division.
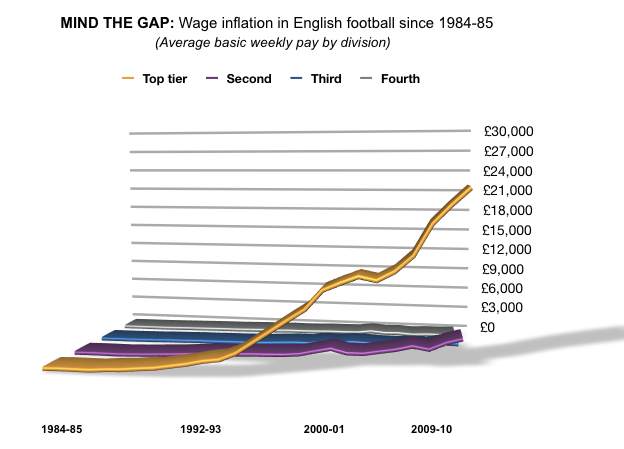
It should be stressed: the gap between the top division and the fourth was only three times as much. Today the difference is 30 times as much.
As we report elsewhere Sportingintelligence has obtained an official PFA document showing the average basic weekly wages, division by division, for the past 25 years.
The document in its original format can be seen at this link. (With the numbers used in the table at the bottom of this piece).
A table of annual pay and annual rate of growth can be seen at this link.
Here, in one image, you can see how England’s top division has soared cleared of the rest in pay terms since the mid-80s:
The table below sets out the basic weekly wages and the difference between the top division and each of the rest.
The ratio between the First Division when Lineker was a Fox and the other divisions was 1.61 to 1 compared to the Second Division, 2.21 to 1 compared to the Third and 3 to 1 compared to the Fourth.
By the time the Premier League started (1992) it was 1.89 to 1, 3.53 to 1 and 4.63 to 1, which is getting bigger but not anywhere as extreme as it would become.
Now it’s 5.51 to 1, 15.85 to 1 and 29.92 to 1.
.
Sportingintelligence home page today
.


