*
By Nick Harris
SJA Internet Sports Writer of the Year
27 October 2011
Earlier this month, a report was published that said the Premier League was watched by 4.7bn people and that games were streamed into 643m households around the planet.
On no! Here we go again.
That was the view of a number of colleagues, thinking we were back in Royal Wedding territory or yet another fantasy world fabricated by deluded sports administrators or mendacious governing bodies, making stuff up for vanity and sales.
In fact the numbers, produced by the respected Germany-based research and consultancy SPORT+MARKT, are correct, and actually quite modest. And the report, unusually for a piece of work of this kind, explains the numbers include not just live ‘views’ but delayed games and replays and highlights and clips on ‘magazine shows’ – and breaks those numbers down, albeit broadly.
And what you see when you examine a specific market – which we’ll do with the UK, looking closely at two months of games from last season – is how many (or rather how few) people watch specific games. And yet the Premier League still make a lot of money from rights. There’s growth in this market yet.
The S+M research showed 3.9bn people watched games on TV at home, with the balance watching out of home in pubs, bars and clubs. These are cumulative totals, for the whole season combined, not per game. (That was one of Fifa’s old tricks, pretending that!)
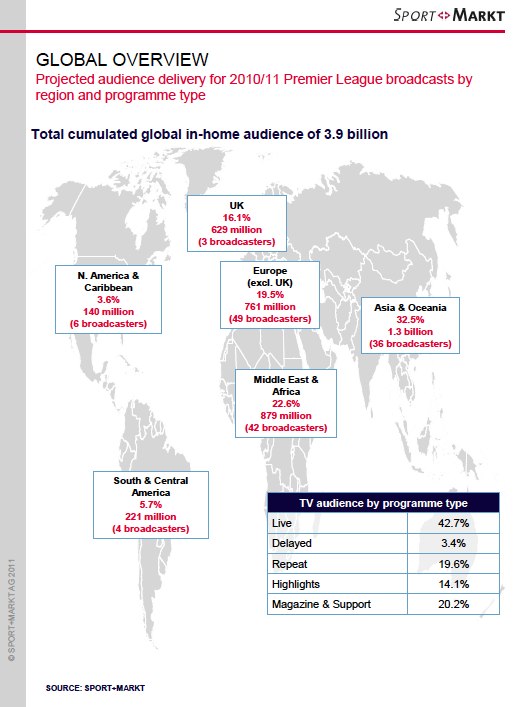
We reproduce the graphic below with the permission of SPORT+MARKT to show the regional breakdown of where the 3.9m ‘views’ were recorded in 2010-11.
(Click on graphic to enlarge, and article continues below)
.
.
Those 3.9bn were made up of :
- 629m ‘views’ in the whole season in the UK (with its population of 62m people).
- 761m views in the rest of Europe (731m population).
- 140m views in North America and the Caribbean (550m people).
- 263m views in South and Central America (386m people).
- 879m views in the Middle East and Africa combined (1.4bn people).
- 1.3bn views across Asia and Oceania combined (4bn people).
As the graphic above shows, only around two-fifths of the total 3.9bn audience is watching live as matches happen (42.7 per cent).
That equates to 1.68bn of those people, across 380 games in a season.Which means each game, on average, is watched live by only about 4.41m people in total across the whole world.
This doesn’t seem so surprising when you know live games on Sky within the Premier League’s ‘home’ territory of the UK often don’t get as many as 1m live viewers, let alone multi-millions.
Obviously some big games will be much bigger. (Much bigger, tens of millions). But many matches will have a negligible global live audience, virtually nil, through lack of interest.
After live matches, the next most popular way to consume games at home on TV is via action on ‘magazine & support’ shows. Football Focus in Britain on Saturday lunchtime is such a programme. ‘Support’ programming and preview packages are probably more common outside Britain. Just over 2m people globally combined watch footage from each match, on average, via such shows (total 794m a year), and a similar number watch each match via repeats. (2.02m per game / 770m all season).
Which just leaves around 1.46m people per game, on average, (or 554.1m in total) watching via highlights shows (such as Match of the Day in the UK), and a few hundred thousand people combined watching each game, on average, around the whole world combined, via delayed feeds. As we’ll see in a minute, Match of the Day and MOTD2 in Britain alone contribute more than 200m highlights ‘views’ in the season.
All these different types of programming blend in umpteen different combinations to fit local circumstances, taste, time zones, channel options or constraints and other factors.
Premier League major viewing platforms in the UK
In the UK, it’s important to the major live rights holders Sky that people subscribe to them, but not necessarily that they watch. Sky are not in the numbers game, not in terms of viewing figures for any given programme, because the aim is provide a sufficiently attractive package of whatever content to keep the customer paying.
At the BBC, which holds the highlights rights and broadcasts them as Match of the Day on a Saturday night and in MOTD2 on Sundays, the aim is very much eyeballs – and public service. And because the BBC is free to air (licence fee aside), relatively lots of people watch, even though MOTD and MOTD2 are reasonably late at night. (Though they get repeated).
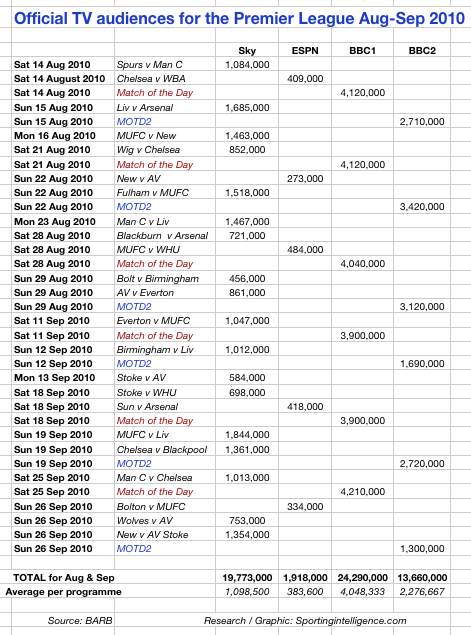
To get a flavour of where Britain’s 629m Premier League views came from in 2010-11, Sportingintelligence looked at the first 23 televised live matches of last season on Sky and ESPN, and also at all the editions of MOTD and MOTD2 during the same period.
The audience figures are freely and easily available via a simple search at the BARB website. Go to ‘Viewing Figures’ on the top menu bar. For BBC1 and BBC2 for the MOTD shows, go to the drop-down ‘Top 30s‘. Then search by channel, year, month and week. And for Sky or ESPN, go to the ‘Top 10s‘. Then search by channel, year, month and week. (You’ll need to know the date and channel of the fixture you’re looking for, you cannot search by match).
Anyway, here are the findings:
Of the 18 live games in the period on Sky, the average audience was only just over 1m people per game. The best-watched game was Manchester United versus Liverpool with 1.844m, and the lowest audience being Bolton v Birmingham with 456,000.
Over at ESPN, the ratings were much lower still, with a high number among five games in the period of 484,000 for United versus West Ham and a low of 273,000 for Aston Villa v Newcastle. ESPN averaged 383,600 viewers a game in this short monitored period.
In contrast, MOTD averaged more than 4m per show late on a Saturday, while MOTD2 averaged 2.3m, and a best show in this period of 3.42m.
In other words, around 22.6m watched 23 live games in total in the period (at under a million people per game), but 38m watched a mere 12 episodes of the MOTD shows, at more than 3m people per show.
MOTD is thus hugely important to the Premier League’s total ‘view’ figures – and so it should be as a cherished national institution. Over the course of the whole season on these numbers, MOTD and MOTD2 together probably contributed well over 200m views to the UK’s 629m – and that’s just from first showings of each. They’re also available on repeat.
The live games on Sky and ESPN contributed at least 120m views and probably more over the whole season.
Other programming from Football Focus to near-live broadcasts and repeats will have made up the balance.
Elsewhere today on this site is a story that reveals Manchester United matches are watched by around half the Premier League’s total global viewing audience, which is mind-boggling.
Less so is SPORT+MARKT’s conclusion that Premier League games reach 643m homes. This sounds terribly impressive but actually it doesn’t mean much more than 643m homes are either technically capable of getting games if they pay the right subscription fees, or live in an area where PL is free-to-air.
There are around 1.9bn households in the world, and around 1.4bn of them have TV have home. Another way to look at the Premier League penetration is to say more than half the world’s households don’t even have access to the providers that show it. That’s a positive in as much as it shows room for growth.
Nor are many people in the 643m households that do have access tuning in, let alone on a regular basis. If they were, the 3.9bn would be a lot higher.
The other statistic that SPORT+MARKT mention is a claim, based on surveys, that are 615 million people around the world who are supporters specifically of one of the 20 clubs from the Premier League.
I’m not quite sure what this means in any practical sense. Manchester United claim 333m ‘followers’ around the world and 139m ‘core fans’.
In either case, it means Premier League clubs (including United) are pretty useless at ‘activating’ this supposedly massive fanbase into actually spending any money. How much, on average, does these ‘core fans’ spend per year, each, on United? Not much at all.
But that’s a subject for a different day. Those core fans are probably too busy to get out and buy merchandise or tickets to Old Trafford. They’re too busy in front of the telly.
.
SPECIAL SERIES: Global Game – how the Premier League is viewed around the world
Sportingintelligence home page
More on Man Utd / Liverpool / Man City / Arsenal / Chelsea (or search for anything else in box at top right)


