By Nick Harris
and Brian Sears
15 August 2013
The chances of correctly predicting the way the Premier League will finish in the 2013-14 season are minuscule; if we assumed that any team is capable of finishing in any position, the probability of getting top to bottom in the correct order is, mathematically, 2.432902e+18 to 1.
To put that in context, the chances of getting just the top 10 in the right order are 670,442,572,800 to 1. Yes, that’s 670 billion to one. And then to complete the 20 teams you need to multiply the 670bn by 3,628,800 to get 2.432902e+18 to 1 for the full division.
Of course we don’t assume any team is capable of finishing in any position. Cardiff will not win the league, for example, any more than Arsenal will finish bottom. So the odds come down hugely when we start factoring in ‘real world’ chances and applying our reasonable expectation that Chelsea, for example, will be far superior in points over the whole season than Crystal Palace, and that Manchester City’s final tally will leave Hull in the shade.
But even using this knowledge, and bookmakers’ odds, to sort the teams into the ‘most likely’ order they will finish, the chances of getting the whole division correct are still, even for the best expert, going to be very, very unlikely – something like 58 million to one.
Below, we consider different ways one might use to try to predict a final table, the first of these using the apparently nebulous concept of each team’s ‘pedigree’, the second using the cash they have spent and will spend, the third an analytical model and the fourth the powers of the manager.
None of these methods are likely to predict correctly the order that the teams will finish, but then even the best expert only has one chance in tens of millions of doing that.
Similarly, our table of tables – a composite of our four models – won’t be right either.
But some of the tables will get some of the teams right, and all of them should throw some light on the title race and its cast of contenders.
Predicting by pedigree
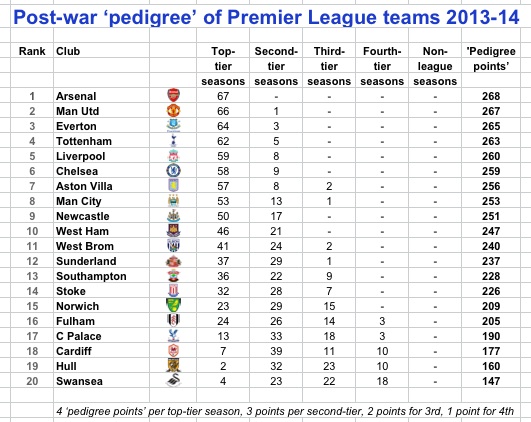
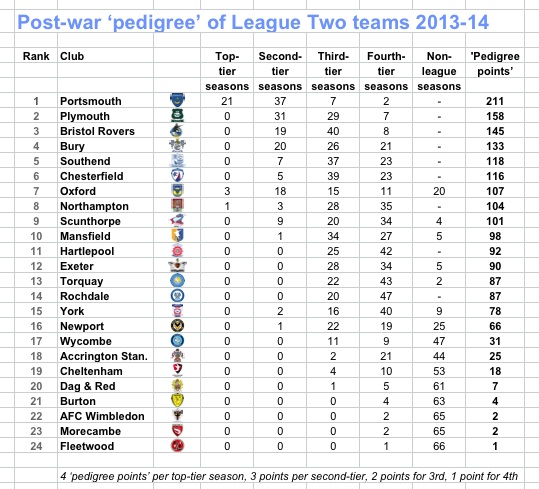
This first table ranks the clubs in order of their post-war ‘pedigree’, using the seasons they have spent in each of the divisions over the past 67 years to calculate a pedigree figure.
Only one club has been in England’s top division for that whole time in one unbroken stretch, and that is Arsenal, who pip Manchester United into second place.
As the table below details, each year spent in the top division since the war is worth four points, each year spent in the second tier (now the Championship) is worth three points, each year in the third tier is worth two points and each year in the fourth tier is worth a point.
Arsenal and United are followed by Everton, Tottenham, Liverpool, Chelsea, Aston Villa, Manchester City, Newcastle and West Ham, in that order, making up the top 10.
At the other extreme, Swansea are bottom with just four top-flight seasons since the war and as many as 18 in the fourth tier, with Hull above them, with even fewer top-flight seasons but more second-tier seasons, then Palace, Fulham, Norwich and so on.
The weakness of this model is that modern football – in the era of big money – has diminished its meaning, because a whopping injection of cash can and does quickly lift a club above its traditional ‘station’.
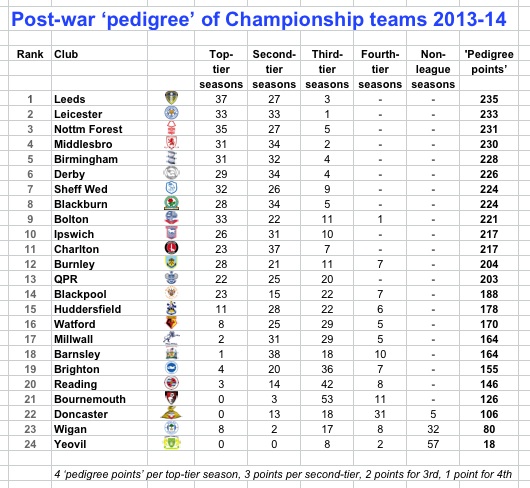
Having said that, as a predictive tool last season (article here), the three relegated teams were all in the bottom four ‘pedigree’ places, and across other divisions, ‘pedigree’ ended up being predictive from Peterborough to Hartlepool to Rotherham, Port Vale, Bradford, Gillingham and many points in between.
Mainly these ‘pedigree’ tables (Premier League here and other divisions at the football of this piece) provide a general sweep of the ‘order of things’ historically.
Yes quite feasibly, the real final table will see most (but not all) of these teams finishing within a handful of places of where they appear in this one, despite its obvious flaws.
Article continues below
Predicting by cash
Money talks in football, with a well-established link in the top divisions of Europe between money spent (on transfers and / or wages) and on-pitch success. Some pieces looking at the Premier League in particular are here and here and here.
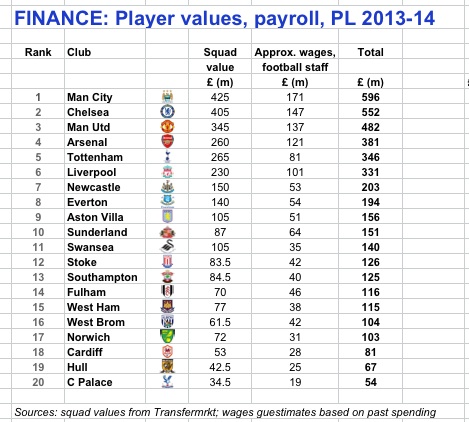
The next table attempts to quantify the value of the squads at each club and the money they might spend in the coming season on ‘football wages’, including all the players (not just the first team), the manager and coaching staff.
There are multiple drawbacks with both the squad values and wages. The squad values are taken from Transfermarkt and make a decent stab at the market value of each team, most typically based on transfer fees. But the value of each squad is dynamic: it can and will change over the next few weeks and certainly over the season. These squad values give a ‘snapshot’ at best, albeit on a like-for-like basis.
The wage spend is educated guesswork based on previous seasons and behaviour but there will be huge margins of error for some clubs. Manchester City and Aston Villa insist their wage bills are coming down and won’t be as high as here. Tottenham’s bill will shoot up if they hire several decent names and we can only speculate how much cash clubs from Cardiff to Sunderland are gambling on attracting new players.
Having said all that, this cash table will be strongly indicative of the real financial outlay of the 20 clubs relative to each other, with City and Chelsea out ahead of Manchester United, and Arsenal next (unless Arsene Wenger splashes the cash), with Spurs and Liverpool filling out the top six.
Swansea are perhaps a surprise as high as No11 but their estimated squad value has been boosted by last season’s performances that make players bought cheaply much more valuable now.
Is it feasible that this table, on its own, reflects what will happen this season? Not many fans would be shocked if the top six in this table filled the top six places in the real table, and the bottom five in this table finished as the bottom five in the real table and the rest fill the middle.
But with weeks remaining of the transfer window, things could yet change a lot.
Article continues below
Predicting by analytics
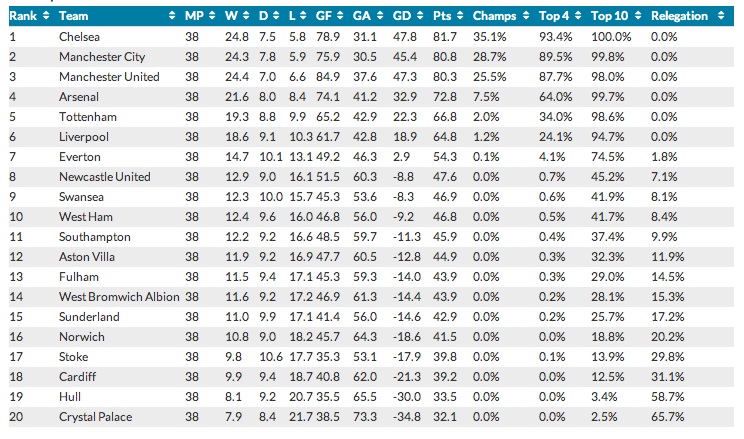
There are all manner of statistical predictions for the season ahead, from Infostrada’s here (which has Manchester United winning the title, seven points ahead of Chelsea and City), to the more ‘specific’ forecasts of the folk at Bloomberg sports. You can see Bloomberg Sport’s tables and methodology here.
It’s a personal preference but based on methodology and detail, we prefer the Bloomberg model, and recommend having a look at their site for more details. This is their final table below.
Article continues below
Predicting by managers
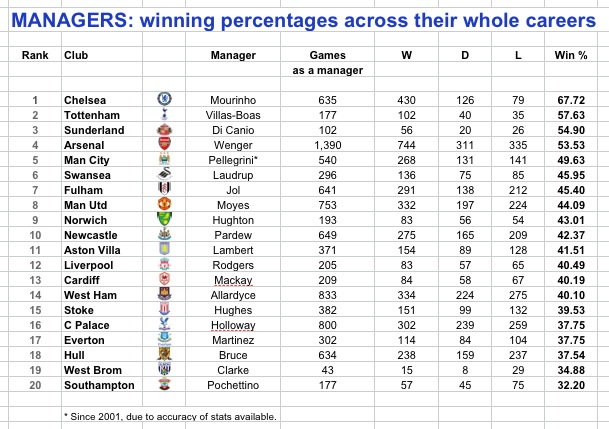
The chart below shows the managerial win rates of the 20 bosses who will start the new Premier League season, ranked by win percentage through their careers.
The obvious flaw here is comparing achievements across different levels and in different countries. Paolo Di Canio is absurdly high on this list almost wholly on the basis of success at low-level Swindon where he spent freely on players and wages, way above his rivals.
The counterpoint to the drawback is that is most of these managers have a mix of levels and countries on their CVs – and in that respect are comparable. In any case, some have little or no Premier League experience to count.
There is one absolutely stand-out manager here in terms of achievement and that is Jose Mourinho with his staggeringly good win rate of more than 67 per cent across some of the biggest clubs in Europe. Arsene Wenger’s rate of almost 54 per cent over such a long period is also exceptional.
More than anything, this table reflects the big differences in experience and success.
Article continues below
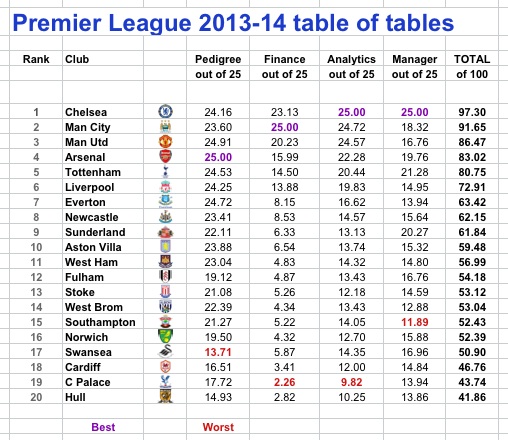
Composite verdict
Having taken our four different ways of assessing the teams, we’ve given each club a score out of 25 for pedigree, cash, analytics and managers, relative to each other. So Arsenal get 25 for pedigree City get 25 for finance, and Chelsea come out on top in analytics and managers.
Again, this is flawed, just as all our methods are flawed. But then there are no flawless methods: hence 58 million to one.
Our four methods should perhaps be weighted, with cash given most weight, then managers and analytics with pedigree not much weight at all in this big money era. But that too would be a flawed approach. We already have a money-only table if you want to know about money.
Instead we have equally weighted the four metrics. And the final table is below.
Chelsea for the title ahead of City, United and Arsenal not so very far behind. Cardiff, Palace and Hull for the drop.
This is what the numbers thrown together say. It won’t happen. A personal view at Sportingintelligence is that neither Newcastle or Sunderland will finish in the top 10, and that Swansea probably will.
Who knows? That’s the beauty of it.
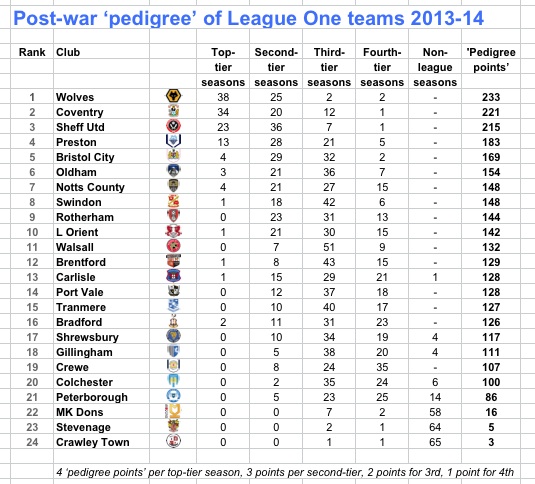
Pedigree tables of the Championship, League One and League Two
More by Nick Harris / Brian Sears
Follow SPORTINGINTELLIGENCE on Twitter
Sportingintelligence home page