
By Nick Harris
1 June 2015
The 2015 Women’s World Cup (WWC) kicks off this coming weekend in Canada, and it will be the seventh edition of a tournament that has come a long way in short time.
At the first tournament the games were 80 minutes long, there was a single sponsor, the final wasn’t shown on TV in the winning nation’s country, and there was no prize money. That was in 1991.
Prize money wasn’t actually introduced to the WWC until the fifth tournament, in 2007, when the total prize fund was $5.8m, rising to $7.6m in 2011.
The prize money in 2011 was equivalent to 2% of the men’s 2010 World Cup prize fund of $380m the year before. The women’s game is closing the gap but still has some way to go to parity. The 2015 WWC prize fund of $13.6m is 3.3% of last year’s 2014 World Cup prize fund of $406m.
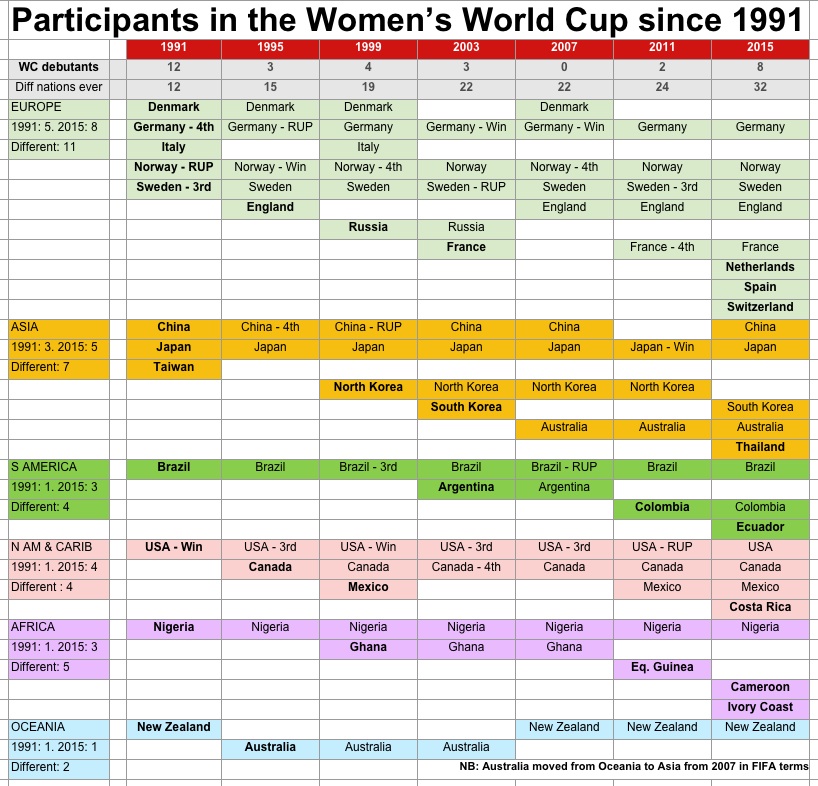
The WWC is expanding though, to 24 nations this year. The first graphic shows how the event has grown over time, by participants. It’s designed to be read either by column (for participants in any given year, read vertically) or by row (if you want to track the progress of any one nation over time).
Nations in bold are making their debuts. Winners, runners-up, third-placed and fourth-placed teams are noted. Summaries of all-time appearances by teams from each confederation are on the left; for example there were five European teams in 1991, and that has grown to eight in 2015, and there have been 11 different European teams altogether.
Article continues below (click to enlarge)
.
The next graphic includes more detailed performance statistics for every nation to have competed in a WWC to date. The nations are ranked by the total number of people who have watched each of them at WWC matches live, most to least. Click to enlarge. It is appropriate that the USA is the leading nation in this respect because they are the leading WWC nation in many respects.
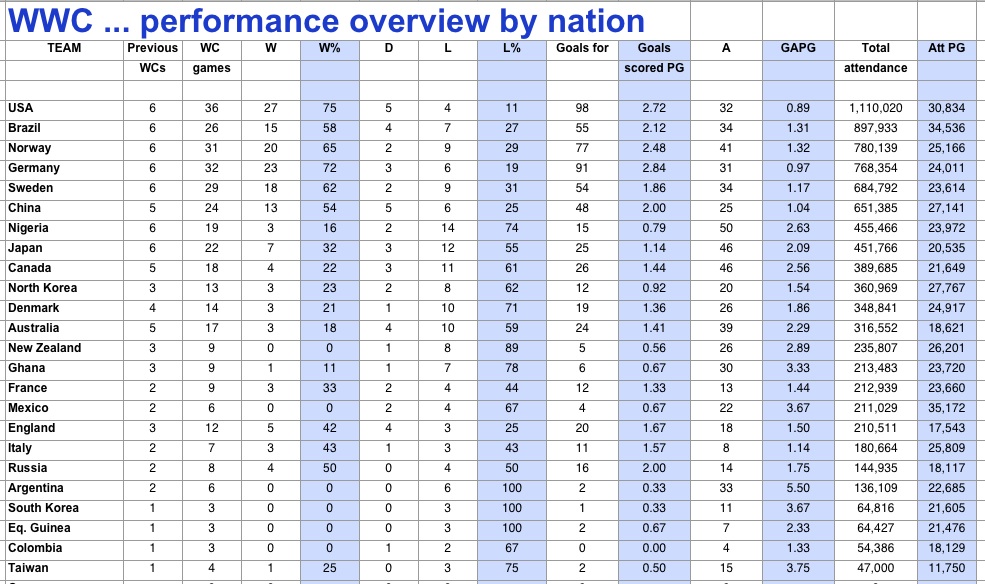
i: The USA played in the best attended women’s football match of all time, the 1999 WWC final v China, attendance 90,185. The USA won that 1999 final, having also won in 1991, so they have won the WWC the joint most times, twice, the same as Germany. But the USA have also been runners-up once (2011) and third three times (1995, 2003 and 2007) so the USA are unique in never finishing off the podium.
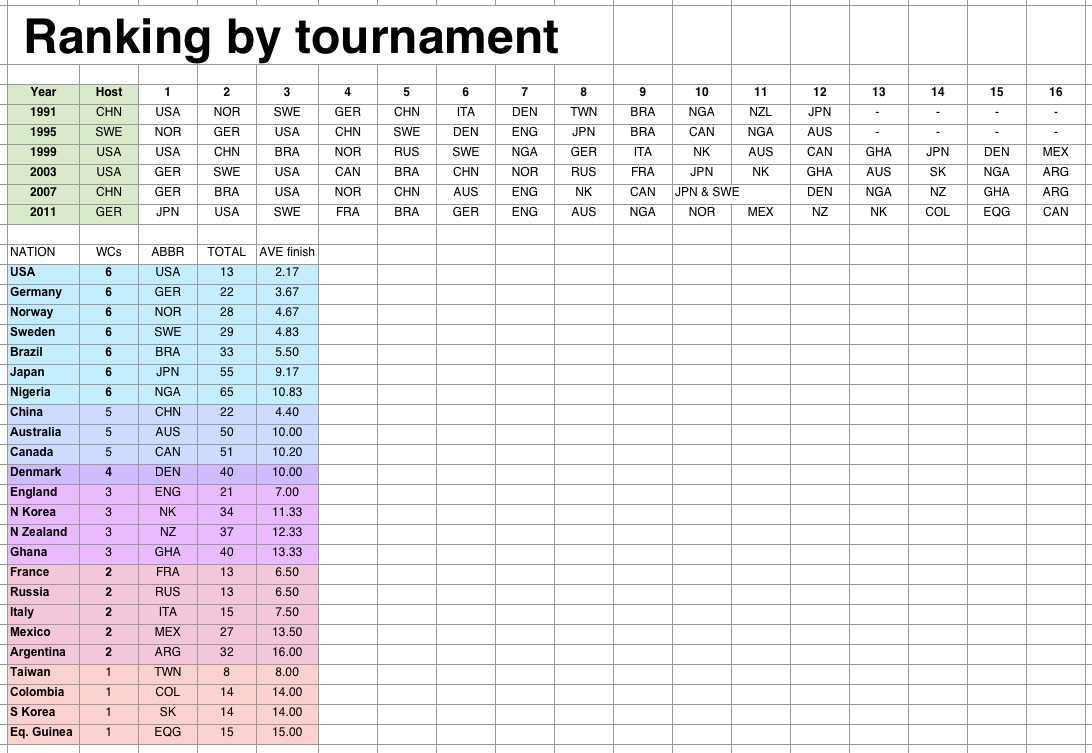
ii: The USA have been hosts of the tournament joint most (twice 1999 and 2003). China have also hosted twice. The USA have the best average ‘finishing’ position of any nation, 2.17, which is the total ranking of their six tournaments to date (1+1+2+3+3+3) divided by six. Germany are next best in this regard on 3.67. (This and other stattery in the graphic below, which you can click on to see properly).
iii: The player with the most matches in WWC history is an American (Kristine Lilly, 30 matches between 1991 and 2007). Four of the top five players with most matches at the WWC are Americans. After Lilly: 24 matches Julie Foudy (USA) & Birgit Prinz (GER); 23 matches Joy Fawcett (USA); Mia Hamm (USA). The USA as a nation has played most WWC games (36), and has also won the most (27) and won the highest percentage (75%).
iv: The oldest player ever at a WWC was American, Christie Rampone, aged 36 years and 23 days in 2011.
 v: The player with the most goals scored by one player at one WWC finals was American, Michelle Akers, who scored 10 goals at the 1991 WWC. Akers also holds the record for most goals by one player in one WWC match: five vs Taiwan in 1991. The USA have most all-time WWC goals, 98, and have conceded the fewest per game (0.89), all-time.
vi: The goalkeeper with the most clean sheets in WWC history is American, Briana Scurry, who had 10 WWC shutouts between 1995 and 2007. The USA have the most clean sheets in WWC history 1991-2011 (18 clean sheets).
vii: The nation with the most goals in one WWC tournament: the USA in joint first place (25 goals in 1991) with Germany (25 goals in 2003). The USA leads the way in scoring 3+ goals in a game at WWC tournaments; they have done this 20 times, or in 56% of their WWC games. Next best Germany have only done it 15 times (47%).
viii: Americans have even refereed more matches than any other nationality. Of 180 WWC matches in total, the referee has been American on 14 occasions. Most common nationality of WWC referees: American, 14 games; Canadian: 12; Australian: 11; Swiss: 10.
.
Women’s World Cup becoming more competitive
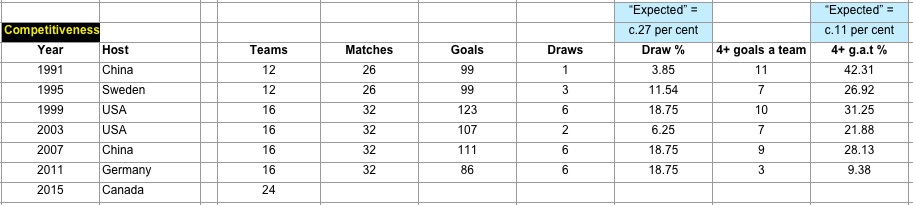
In a mature, competitive football league or competition, you would expect roughly one game in three to four to be a draw; and about one in 10 games to involve one side scoring 4+ goals in a single match. Using all-time data from the English Premier League, for example, 27 per cent of all games have been draws and 11 per cent have had 4+ goals for one team in a single game.
How has the women’s World Cup compared over time?
In 1991, there was just one draw from 26 matches, or 3.85% and 11 of 26 games were thrashings as defined (42%). That is the hallmark of a tournament awash with uncompetitive one-sided matches.
Over time, as the graphic below shows, the draw rate grew to 18.75 per cent for the last two tournaments as it became more competitive; and the thrashings decreased to ‘normal’ levels. The women’s World Cup is becoming more competitive.
.
The growth of the Women’s World Cup in numbers
1991
80 Minutes played per match. It wasn’t until the 1995 event women played 90 like the men.
1 Sponsor for the tournament: M&M’s. The teams played for the M&M’s Cup.
Zero The number of TV channels in America screening the final, featuring USA beating Norway. Mia Hamm, then 19 and a rising star, said: ‘When we came home, we thought we’d just conquered the world. And there was one media person there.’
1995
8 The number of teams from the 1995 World Cup who became the participants in the inaugural Olympic women’s soccer tournament, at the Atlanta 1996 Games. The best eight teams at the WWC qualified, showing how the WWC’s status was accepted as global ‘currency’.
6 The number of matches from the 1995 tournament screened in the USA.
2 The number of minutes allowed per team per half for an experimental ‘time-out’. The tournament was now viewed significant enough to be a test ground. The idea did not take off.
1999
90,185 The biggest attendance at any women’s sports event in history. For the final, USA v China at the Rose Bowl.
4 The number of different continents represented in the top four: USA (N Am) beating China (Asia) in the final, and Brazil (S Am) beating Norway (Europe) in third-place play-off.
41.7% The proportion of girls and women of the total people in the USA playing soccer (7.5m of 18m), a 34% increase since 1991.
2003
1 The number of winning World Cup teams coached by a woman, after Tina Theune-Meyer of Germany became the first at this WWC.
4 The number of participant nations with at least one professional player contracted in the USA at the time of the tournament, a record.
18 Matches out of 32 showed on US TV.
2007
23,181,126 Page views on the FIFA WWC website during the tournament. This metric was not significant enough to measure in 2003. (By 2011 it was 125,741,477).
200 The number of different countries showing at least one game on TV, a record, and an increase of 25% on 2003.
15% Percent of the total $67m ‘development funding’ spent by world governing body FIFA on women’s football. A rise from 10% previously.
2011
7,196 Tweets per second during the closing minutes of the 2011 WWC final. This set a new Twitter record for any event of any genre, not just sports let alone women’s sports. That eclipsed events including the death of Osama Bin Laden, the wedding of William and Kate, and any Super Bowl to that date.
12 Major sponsors affiliated to the event, a record, six global and six national, with the entire sponsorship programme ‘sold out’ 18 months before kick-off, a record.
407.8 million The number of different people around the world who saw at least three minutes of any World Cup match during the tournament live on TV, a record, and a rise of 3% on 2007. The average live TV audience per match globally was 13.2 million (+17% on 2007).
.