By Nick Harris
SJA Internet Sports Writer of the Year
11 December 2012
Queens Park Rangers are odds-on to be relegated from the Premier League this season but it should be no surprise that they are struggling.
They achieved far too little last season, considering the money they spent, and avoided relegation by a point. And there is an argument that the 2011-12 underachievement not only highlighted a systemic failure at Loftus Road, but doomed them for this campaign.
Trying to ‘prove’ this with real numbers and hard data is complex, but certainly there appears to be a compelling pattern emerging in the Premier League in recent seasons of predictable economic-based failure, on the pitch.
Newcastle United, for example, were the stand-out financial ‘basket case’ in the 2007-08 Premier League, achieving much less than their wage spending should have dictated. The precise details are explained below; they were relegated the next season.
Portsmouth were the stand-out financial ‘basket case’ in the 2008-09 Premier League, achieving much less than their wage spending should have dictated. They were relegated the next season.
West Ham were the stand-out financial ‘basket case’ in the 2009-10 Premier League, achieving much less than their wage spending should have dictated. They were relegated the next season.
Aston Villa were the stand-out financial ‘basket case’ in the 2010-11 Premier League, achieving much less than their wage spending should have dictated. They avoided relegated by two points last season but are ailing again this season.
When we have the full data available on who spent what on wages for last season, 2011-12, it is inevitable that high-spending QPR will emerge as one of the clubs, if not the club, who most underachieved against what they spent. And that is why they’re struggling now.
It is not the spending per se that is the problem (spending usually helps); it is spending consistently badly.
The theory: money buys success
It is well established in top-flight English football that the more you spend on players’ wages, the better you will perform.
In their book Soccernomics (also known as Why England Lose), Professor Stefan Szymanski and author Simon Kuper looked at 20 years of wage data and concluded that wage spending could account for 90 per cent of the variation in league position.
In layman’s terms they’re saying cash counts most of all, and that luck, and the input of a good or bad manager, and other variables, are much lesser considerations.
Sportingintelligence also calculates, on an annual basis, the average first-team salaries at a lot of different teams in different sports around the world, from the NBA, NFL and MLS to the major football leagues of Europe to Japanese baseball and Aussie Rules football. The most recent findings were published in May; and the methodology and background can be explored here.
The bottom line is a figure for average first-team pay that can be used to compare different earnings in vastly different sports and leagues on as much of a like-for-like basis as possible. And when our data for the Premier League alone was borrowed for a project in the Wall Street Journal in 2010, the WSJ calculated that success in the Premier League was 85 per cent determined by wage spending. (In the NFL it was 14 per cent).
We can quibble over 90 per cent or 85 per cent but the conclusion is the same: money talks.
If you consistently (and the emphasis is consistently, over years) spend a larger amount of cash on wages, then it will almost certainly pay dividends. Back in May this year, we explored in precise detail how the spending at Manchester City since 2008 had taken them from mid-table also-rans to Premier League champions.
The exceptions who prove the rule: the economics of failure
Using exactly the same principles, and the same graphics from the City piece in May, but by additionally presenting the same data in a different way, the identities become clear of the exceptions who prove the rule: Newcastle, Portsmouth, West Ham, Villa and so on.
First let’s consider what happened in 2007-08 in the Premier League.
This first graphic may look complicated but isn’t. The blue towers are wage spending, with height relative to each other based on spending.
The green towers are points, also relative to each other in height.
The 20 clubs in the Premier League that season are listed in the order they finished, with the number of points they achieved, plus the average first-team salary at that club for that season.
At a glance, we can see the strong relationship between money and success: those clubs who spend loads do well, while those who spend little do badly. That’s the rule, and the exception that season was Newcastle, sticking out like a sore thumb, their blue tower utterly out of proportion to their green tower.
(Article continues below)

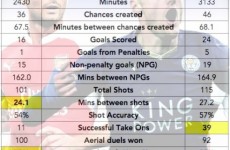
Now look at the same data presented in a different fashion, in a straight list of how much each point cost each club per player.
Newcastle’s average first-team wage that season was £2.13m and they got 43 points so they spent £49,612 per point per player. More than anyone on that measurement. And yet they finished 12th.
Look at all the names near the top of this list. They are either the big clubs who are spending a lot per point and getting top-6 finishes (Chelsea, Man Utd, Liverpool, Arsenal, Aston Villa), or they are in trouble, or about to hit trouble (Newcastle, Derby and West Ham).
The key determinant remains that the big spenders finish at the top (United, Chelsea, Arsenal, Liverpool) and the small spenders at the bottom (Derby, Birmingham, Reading, Fulham, Bolton and so on).
But what this graphic flags up is a big relative spender (Newcastle) with a woeful return – and trouble ahead.
(Article continues below)

.
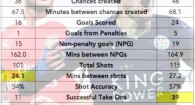
Here’s the overall picture for the 2008-09 season.

.
And here is the same data on £ per point per player basis.
Newcastle relegated, Portsmouth heading for trouble, the other high-ranking clubs spending a lot to achieve a lot.
Article continues below

And here’s what happened in 2009-10.
And beneath that, the same data flagging up the problems at West Ham.


And here is the overall picture for 2010-11.
And below the list that shows Villa will struggle in 2011-12.


.
Only a few clubs have so far reported their 2011-12 numbers, and we will continue to monitor them and calculate the corresponding detail. Based on early information, however, QPR will be high on the cost per point per player for 2011-12, while low on achievement.
So next time anyone asks why they’re struggling, tell them it’s the economy, stupid.
.