By Dan Kennett
5 January 2012
MONEYBALL. As someone who works with data on a daily basis in a business environment, Moneyball appealed to me on many levels, not least because the story was so well written by Michael Lewis and the Hollywood movie was pretty entertaining too. (See trailer, article continues below).
.
.
However, Moneyball to me is less about personality and a romantic sports story, it’s about the implementation of a specific approach and method, namely Sabermetrics.
The detail of what Sabermetrics actually involves is unimportant. However, it’s probably interesting to note that the term was derived from the Society for American Baseball Research (SABR) and coined by the godfather of baseball statistical analysis Bill James.
James was an economics graduate and went from being a night-shift security guard at a food processing plant to his current role as a consultant to the Boston Red Sox. This 30-year journey also saw him progress from heretic to revolutionary to deity.
The critical importance of Sabermetrics is institutionalising the use of data to make decisions and measuring what really matters. Also by making it empirical, it removes much of the opinion or “noise” from the debate.
In my industry it is the difference between managing and quantitatively managing, replacing subjective opinion with data and reducing the risk of making a bad decision.
Sabermetrics turned the art of baseball into a science. With scoring runs being a process, winning became an equation. If you could get the right variables into that equation and process you could create wins. In terms of player recruitment you would be buying wins.
It’s fair to say that in football we are only just scratching the surface in the use of data. Forget “creating wins” in football, we don’t even know if we are collecting the most important data yet!
The fluid nature of the game and the low quantity of scoring by definition makes football more difficult to statistically analyse than a set-piece game like baseball or cricket. However that’s not to say that we can’t use the data that we already have to help us. Especially to complement traditional scouting or to validate decisions.
Football is a simple game. Score one more goal than you concede and you win. So obviously any data showing how effective players are at scoring goals will help you understand which players are valuable and which are not.
The difference between football and baseball is that while a batter has a direct contest with a pitcher every ball, a striker is reliant on his team-mates to put him in the position to score.
There’s also a whole host of shooting stats out there (total shots, blocked shots, shots on target, shots inside the area etc) so how do we know which ones are important? For this article I’ve settled on “Clear Cut chances”. These include the following:
- Penalties
- Striker one-on-one with the goalkeeper
- A free header close to goal
- A shot extremely close to goal or with clear line of sight to the goalkeeper
The reason I have settled on this is because in the last year and a half, 50 per cent of all Premier League goals have resulted from “Clear Cut” chances.
In the 2010-11 season, there were 1,053 goals scored in total and 535 of these were as a result of “clear cut” chances (51 per cent).
Up to 11 December 2011 in the 2011-12 season, 47 per cent of all goals were from “Clear Cut Chances”.
There’s an 80 per cent correlation between “Clear Cut” chances and goals scored. It’s also a reasonable assumption that there is a significant relationship with results, even if this hasn’t been quantified.
The key therefore becomes maximising the conversion rate of those “Clear Cut” chances and finding players who can do that, especially when it’s a player to whom a lot of “Clear Cut” chances fall.
From now I am going to call this “Clinicality”.
The Premier League average for clinicality in 2010-11 was 37 per cent, in 2011-12 so far (to last month) it was 38 per cent. An over performance in clinicality could clearly give you a competitive edge over a similarly matched opponent over the course of a season.
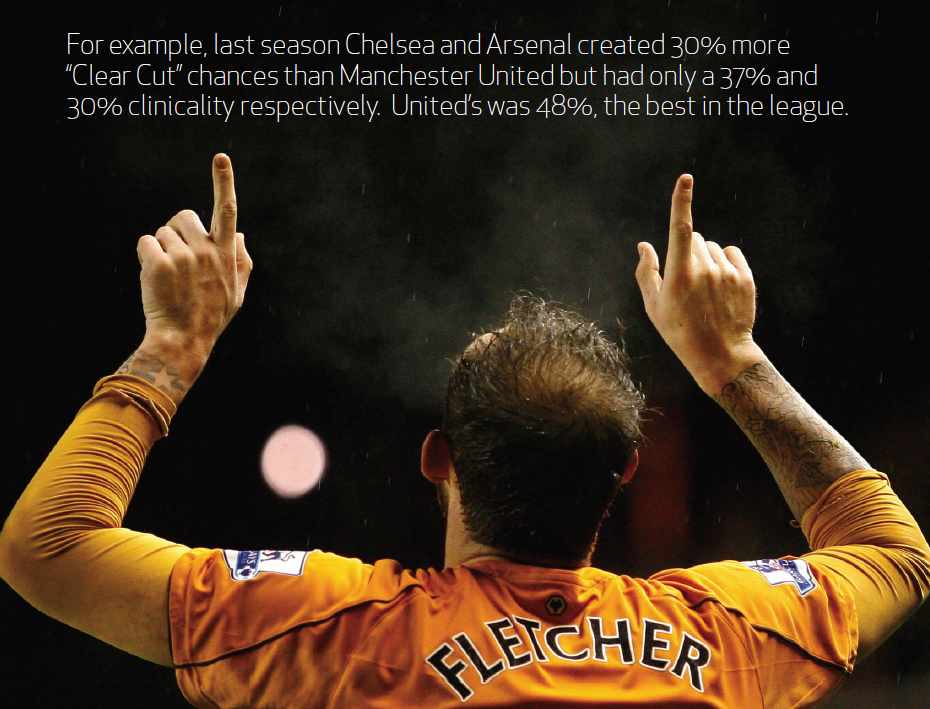
For example, last season Chelsea and Arsenal created 30 per more more “Clear Cut” chances than Manchester United but had only a 37 per cent and 30 per cent clinicality respectively.
United’s was 48 per cent, the best in the league.
So the question has to be asked, if Arsenal and Chelsea had been better equipped to score their “Clear Cut” chances, could they have won the league?
If we look at United’s data in more detail then we can see that 73 of their 88 “Clear Cut” chances fell to just four players and three of them were over the league average:
Player / CCC / CCC Scored / Clinicality
Berbatov 25 / 13 / 52%
Rooney 14 / 6 / 43%
Hernandez 20 / 8 / 40%
Perhaps what’s most surprising there is seeing “goal poacher extraordinaire” Javier Hernandez behind both Berbatov and Rooney.
For Arsenal, Robin van Persie was 10/25 for a clinicality of 40 per cent but only played half a season. No-one else who played regularly was over 30 per cent.
Chelsea scored as many “Clear Cut” chances as United, but missed so many more. While Frank Lampard outperformed Rooney with 8/16 for a clinicality of 50 per cent, Solomon Kalou and Didier Drogba combined efforts were a wasteful 11/38 (29 per cent).
So who were the star over-performers? Well there were 39 players who had 10 or more “Clear Cut” chances over the season. Eight of these had a clinicality of 50% or better. These have been ordered by how frequently they score a “Clear Cut” chance. Also included is another important shooting stat, “Penalty Area shots per goal”.
1. Dimitar Berbatov (Manchester United)
Clear Cut Chances 13/25
Clinicality 52%
Minutes per CCC scored 170
Minutes per CCC missed 184
Penalty Area shots per goal 3.5
 2. Steven Fletcher (Wolverhampton Wanderers)
Clear Cut Chances 8/11
Clinicality 73%
Minutes per CCC scored 174
Minutes per CCC missed 465
Penalty Area shots per goal 2.9
3. Peter Odemwingie (West Bromwich Albion)
Clear Cut Chances 12/21
Clinicality 57%
Minutes per CCC scored 224
Minutes per CCC missed 298
Penalty Area shots per goal 4.0
4. Frank Lampard (Chelsea)
Clear Cut Chances 8/16
Clinicality 50%
Minutes per CCC scored 253
Minutes per CCC missed 253
Penalty Area shots per goal 3.0
5. Dirk Kuyt (Liverpool)
Clear Cut Chances 11/17
Clinicality 65%
Minutes per CCC scored 256
Minutes per CCC missed 470
Penalty Area shots per goal 3.0
6. Rafael van der Vaart (Tottenham Hotspur)
Clear Cut Chances 8/12
Clinicality 67%
Minutes per CCC scored 280
Minutes per CCC missed 560
Penalty Area shots per goal 2.9
7. Maxi Rodriguez (Liverpool)
Clear Cut Chances 7/14
Clinicality 50%
Minutes per CCC scored 292
Minutes per CCC missed 292
Penalty Area shots per goal 3.7
8. Clint Dempsey (Fulham)
Clear Cut Chances 7/12
Clinicality 58%
Minutes per CCC scored 443
Minutes per CCC missed 620
Penalty Area shots per goal 4.7
.
So huge credit to Steven Fletcher and Peter Odemwingie, despite playing in teams that finished in the bottom half and create far less chances than the top sides, they hugely outperformed some of their peers who perhaps erroneously have the tag of clinical finishers or goal-poachers. For Fletcher, what’s just as important is how infrequently he misses, just once every five games.
What’s more, Fletcher is sustaining his form this season while players like Odemwingie and Dempsey have dipped slightly so far this season.
Steven Fletcher (2011-12 season to mid-December)
Clear Cut Chances 4/5
Clinicality 80%
Minutes per CCC scored 185
Minutes per CCC missed 739
Penalty Area shots per goal 2.5
.
It’s also worth noting players who had less than 10 “Clear Cut” chances last season but had extremely high clinicality
• Youssuf Mulumbu (West Bromwich Albion) 4/4 (100 per cent)
• Charlie Adam (Blackpool – now Liverpool) 8/9 (89 per cent)
• Craig Gardner (Birmingham – now Sunderland) 4/5 (80 per cent)
As well as looking at the top over-performers, it’s always worth looking at the worst under-performers too. This is the less popular side of the Sabermetrics approach; challenging the accepted reality and the general public perception.
The top five with 10 or more “Clear Cut” chances and clinicality of less than 25 per cent.
1. Marouanne Chamakh (Arsenal)
Clear Cut Chances 4/17
Clinicality 24%
Minutes per CCC scored 461
Minutes per CCC missed 142
Penalty Area shots per goal 6.3
2. Jermain Defoe (Tottenham Hotspur)
Clear Cut Chances 0/10 (ZERO)
Clinicality 0%
Minutes per CCC scored N/A
Minutes per CCC missed 148
Penalty Area shots per goal 0 from 33 shots
3. Carlton Cole (West Ham United)
Clear Cut Chances 2/14
Clinicality 14%
Minutes per CCC scored 1,058
Minutes per CCC missed 176
Penalty Area shots per goal 8.8
4. Andriy Arshavin (Arsenal)
Clear Cut Chances 3/13
Clinicality 23%
Minutes per CCC scored 731
Minutes per CCC missed 219
Penalty Area shots per goal 6.3
5. Cameron Jerome (Birmingham – now Stoke)
Clear Cut Chances 2/10
Clinicality 20%
Minutes per CCC scored 1,329
Minutes per CCC missed 332
Penalty Area shots per goal 12.0
There are a number of teams who have goal-scoring issues in this season’s Premier League: Sunderland, Everton, Wigan and Liverpool among them.
If one of them makes a move for Dimitar Berbatov, Steven Fletcher or Peter Odemwingie and you find yourself nodding sagely in agreement then you know that you’ve taken your first step into a data-driven world. The football data revolution has started. Make sure you get on board.
.
 The article appears in the January issue (left) of FC Business Magazine, the business magazine for the Football Industry in Britain.
.
You can follow the author, Dan Kennett, on Twitter. Dan is also a regular contributor to The Tomkins Times and is involved in the ongoing Pay as You Play project from the same stable.
.
The FC Business website is linked here while the January issue is available as an eversion here. FC Business’s editor, Ryan McKnight, is on Twitter here.
.
More on Man Utd / Man City /Arsenal / Liverpool / Chelsea (or search for anything else in box at top right)
Follow SPORTINGINTELLIGENCE on Twitter
Sportingintelligence home page


