By Nick Harris
21 July 2014
With almost four weeks still to go before the start of the 2014-15 Premier League season, the PR battle for TV viewers in the host country of the world’s most-watched domestic football league is well underway. Sky Sports will again have the lion’s share of the live games in the UK, having paid £2.28 billion for a majority of the UK live rights for the 2013-16 period. And BT Sport will again be trying to woo a portion of the pay-TV market, having paid £738m for their own share of matches. 
 The wider strategic aims of both companies and an exploration of how these deals are focussed on far more than showing football matches can be read here and here. (It’s all about the long-term triple-play market, now becoming the quad-play market). Suffice to say, for those who still read old-fashioned newspapers in the UK, you will have noticed the upsurge in full-page adverts (right and left) for the two broadcasters over recent days.
One thing that remains true regardless of who is showing the games is that certain teams have mass appeal and will guarantee relatively big audiences, whoever they are playing, while the majority of teams will attract far fewer viewers. Sportingintelligence has looked at the viewing figures for every single live Premier League match screened in the UK last season and the conclusions are clear and unambiguous:
1: Manchester United and Liverpool are the big draws. United’s average audience was 1.4m people per match and Liverpool’s was 1.31m. This is in-home TV viewing but clearly indicative of popularity. No other team averaged as many as 1.2m people per game.
2: Sky remains the main player in audience terms, although with a 20-year head start this is to be expected. Sky have somewhere north of 11 million pay-TV customers and more than 7 million of them subscribe to the sports channels. Their average PL audience last season was 1.2 million people per live game. BT Sport’s channels can now be accessed in around 5 million homes, either directly from BT on TV or via apps, or via other means, for example as a bolt-on to Sky or part of a Virgin package. BT’s average PL match audience last season was 562,000 people per match.
3: While these figures will no doubt seem extremely small to many observers, they demonstrate two things; first that pay-TV is not about ratings primarily but about getting viewers to pay for premium exclusive content they cannot get elsewhere; second that having paid for exclusive content, those viewers will want to see the ‘biggest’ and ‘best’ teams most within their subscription packages. That is why, for example, Manchester United were among the most-shown teams (25 of their 38 PL games were live on TV), as were Liverpool (28 of 38), Chelsea (25), Arsenal (25) and Manchester City (25). Less ‘attractive’ teams were shown much less often. Fulham and Cardiff were on TV just eight times each, with Norwich, Hull and West Brom just nine times each.
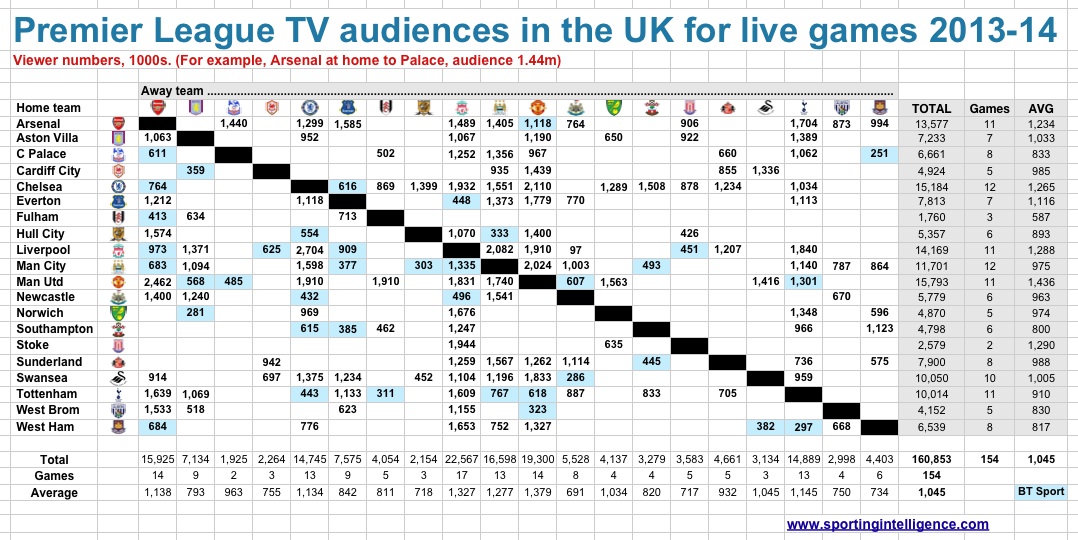
The first graphic below (click to enlarge), shows the TV audiences, in thousands, for each of the 154 live PL matches shown on UK TV in the 2013-14 season. It is self explanatory and shows the big teams were shown most but also got the biggest audiences.
Note that the most-watched matches were all contested between two ‘big’ clubs: the 2.7m who watched Liverpool v Chelsea; the 2.462m who watched United v Arsenal; the 2.1m who watched Chelsea v United; the 2m who watched Liverpool v City and the 2m who watched City v United.
Article continues below GET THE DATA as a free download
.
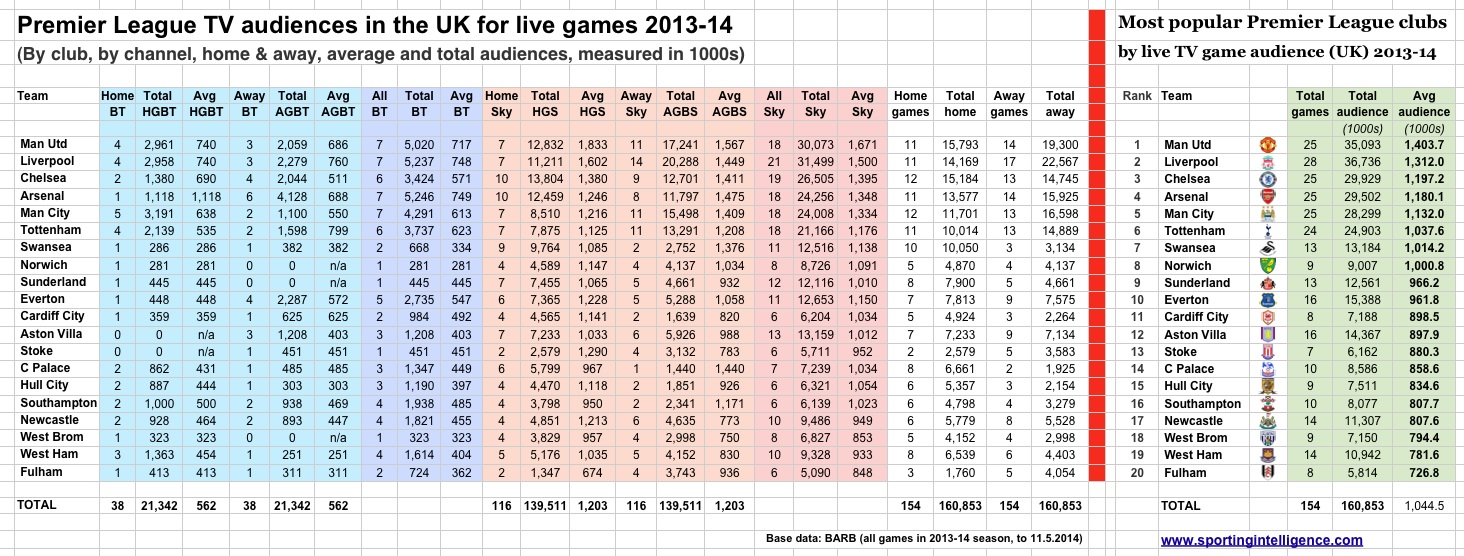
The second graphic – the far right-hand side of it – ranks the 20 clubs from last season in terms of average audience per match, with United at No1 and Liverpool at No2 and so on. Again, click to enlarge it.
It also provides details of every club’s TV audience for home and away games, and by channel. You can see that BT showed the big clubs the most, but only screened one game all season featuring each of Norwich, Sunderland, Stoke and West Brom.
Using United as an example of how to read the table, they were shown seven times on BT Sport (four times at home, average 740,000 viewers, three times away, 686,000) and 18 times on Sky (seven times at home. 1.833m viewers, 11 times away, average 1.567m viewers). Their 25 games were seen by 35,093,000 people at an average of 1.4m per game.
Note that Liverpool were shown away three times on BT and 14 times on Sky, so 17 of their 19 away games were live on TV. That means 17 games of disruption for the traveling Liverpool fan, where disruption is defined as a game not being played at the traditional 3pm kick-off. Yet even more controversial is the way the TV money is shared out, as we’ll deal with in a moment.
Article continues below
.
Money is often cited as being the root of modern football’s evils. The Premier League, say many detractors, is obsessed with cash and to hell with the rest of the game. And certainly there is a whole load of money – primarily TV money – now sloshing around the top division of English football, whereas the rest make do on (relative) scraps.
But in fact the way in which the Premier League’s TV money is divided up is actually much more democratic than most leagues divide their money. See this article for the precise way in which the Premier League divided the TV cash from 2013-14. The ratio between the top earners, Liverpool (£97.5m) and the bottom earners, Cardiff (£62m) was 1.57 to 1.
The comparable figure in the German Bundesliga is 2 to 1; that means Germany is less fair. Then in France it is 3.2 to 1, less fair again, and in Italy 4.2 to 1, and in Spain, where Real Madrid and Barcelona basically take most of the cash between them, it is a whopping 11.3 to 1.
However.
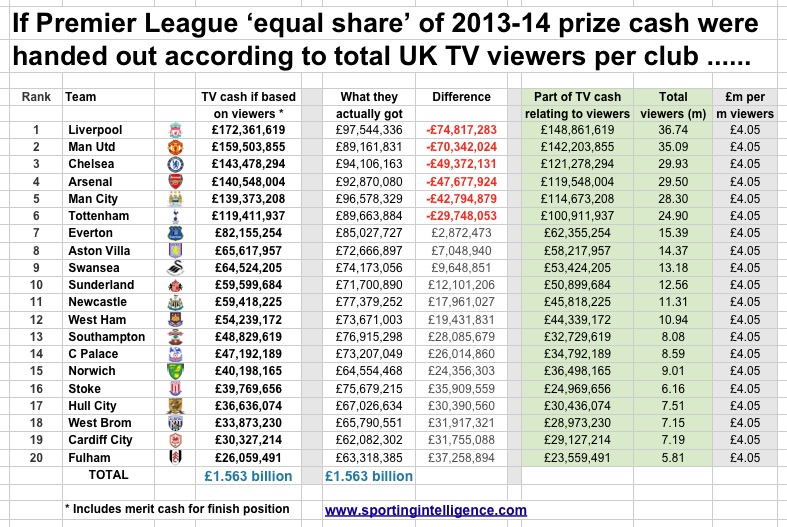
What if the Premier League cash were divided not according to relatively democratic principles, based on equal shares, TV appearances and a sum based on performance, but solely on how many viewers each team attracted? What would the division be like then?
Sportingintelligence has calculated that Liverpool would have got £74m more last season than they actually did, while United would have got £70m extra. Chelsea, Arsenal, Manchester City and Tottenham would also have earned tens of millions more, and everyone else a lot less.
The methodology was as follows: we re-allocated the £1.563 billion pot of cash on the basis of just two metrics: performance and TV viewers. The performance element remained the same as the normal method of distribution, or around £1.2m per place in the table. And the rest was split on total TV viewers. So Liverpool, with 36.74 million TV viewers, got £148.9m at £4.05m per million viewers. And every other club got £4.05m per million viewers to give the totals in the table below.
There is an inevitable argument that United and Liverpool got more viewers because they were shown more times. Absolutely. But they were shown more because that’s what people want to watch. The numbers back it up.
The graphic below is indicative of how unequal football could become; the status quo, at least in revenue share, is actually ‘fairer’ than most other football leagues.
..