By Nick Harris
5 May 2014
It was self-evident in the 2012-13 Premier League that Queens Park Rangers provided their owner with the worst value for money. He spent many tens of millions on buying players and many tens of millions more on paying their wages. And they were ignominiously relegated anyway.
But precisely how badly did they do in terms of resources and performance? And which team did best?
What does this tell us about the relationship between pay and performance in the Premier League? And how does that compare to other football leagues, and indeed other major sports? These are questions Sportingintelligence tries to address using the Global Salary Survey (click for details), as reported here and here.
This article scrapes the surface of giving an overview of an answer for eight leagues: The Premier League, La Liga, Bundesliga, Serie A, NFL, NHL, NBA and MLB.
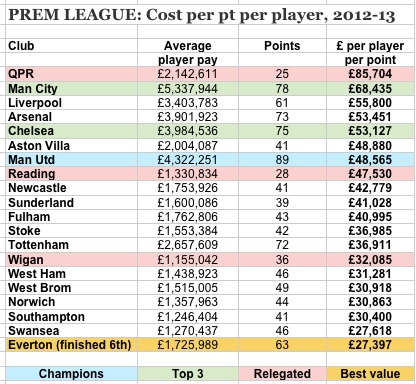
Given that QPR had average first-team pay of £2.1m per player last season and earned 25 points, we can quantify that they spent £85,704 per man per point. That was the worst value by far in the Premier League, with Everton (£27,397 per man per point) giving the best value.
This is how the rest of the division performed:
Article continues below
 .
.
The relationship between pay and performance in the Premier League has been close for many years. This linked article from two years ago goes into more detail, while this one from December 2012 used economic performance to predict QPR’s demise.
The more you spend on wages, the better you do, and vice versa, all other things being equal. And therein lies the beauty of sport. High-spenders can often find ways to cock things up, and low spenders can punch above their weight.
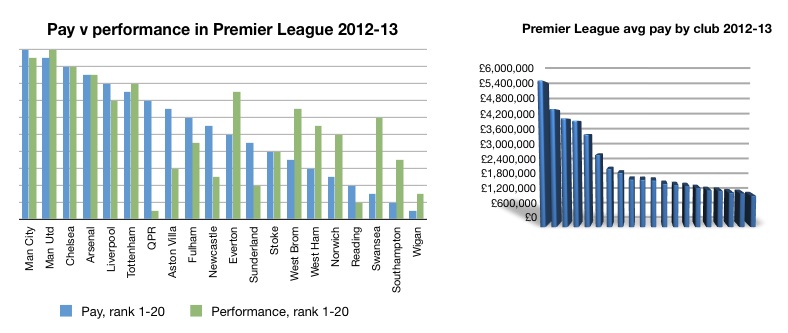
This next graphic plots the wage spending last season, 1 to 20, against finish position 1 to 20, and also depicts the salary spread graphically. You can see at a glance how QPR under-achieved and Everton punched above their weight. You can also see (right-hand chart) how below the top eight spenders, there is a large degree of similarity in pay among the rest of the clubs. What looks like random finishing positions in the left-hand chart are perhaps explained by there not being especially significant variations in wages in the first place.
Article continues below
.
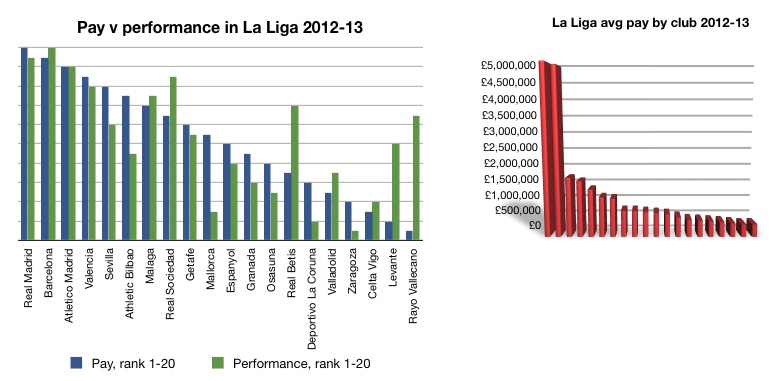
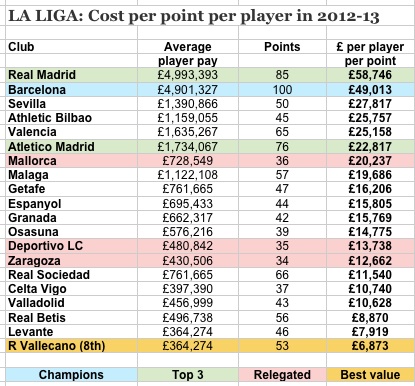
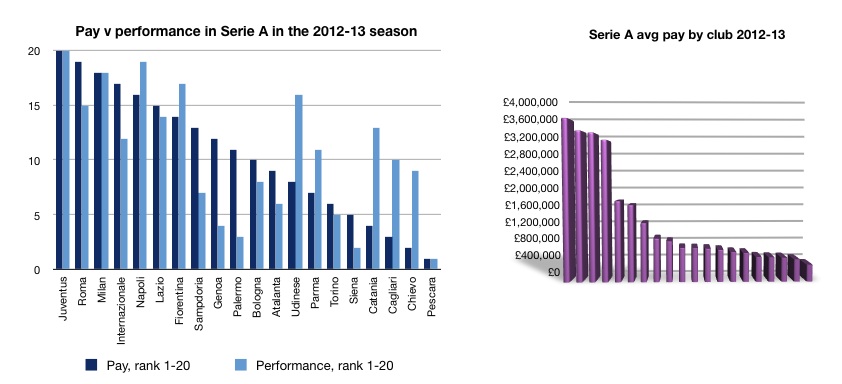
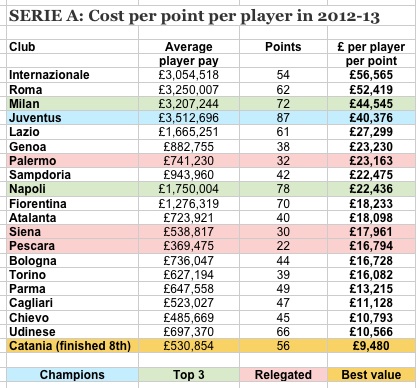
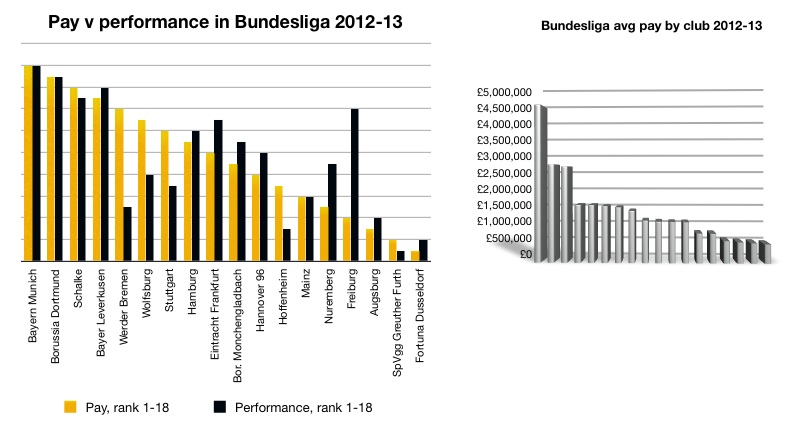
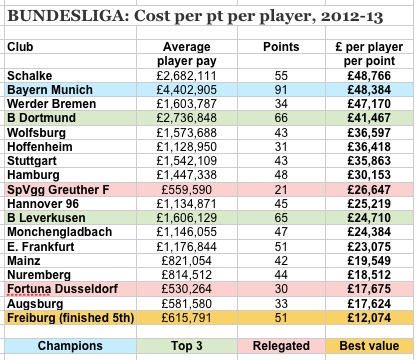
The following six graphics are the equivalent information for La Liga, Serie A and the Bundesliga.
Below them, we move on to the four major North American leagues.
.
North American major sports
There has long been a perception the North American sports are somehow ‘fairer’ because of drafts and wage caps.
But by using the same unique metric as we use across the 15 leagues in seven sports in 12 countries in the GSSS 2014, it is clear that there remains a relationship between pay and performance.
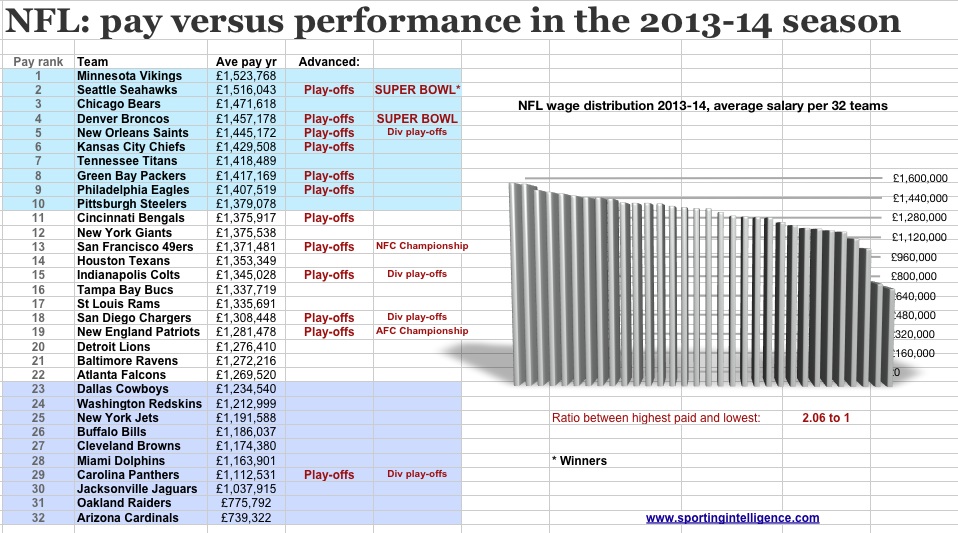
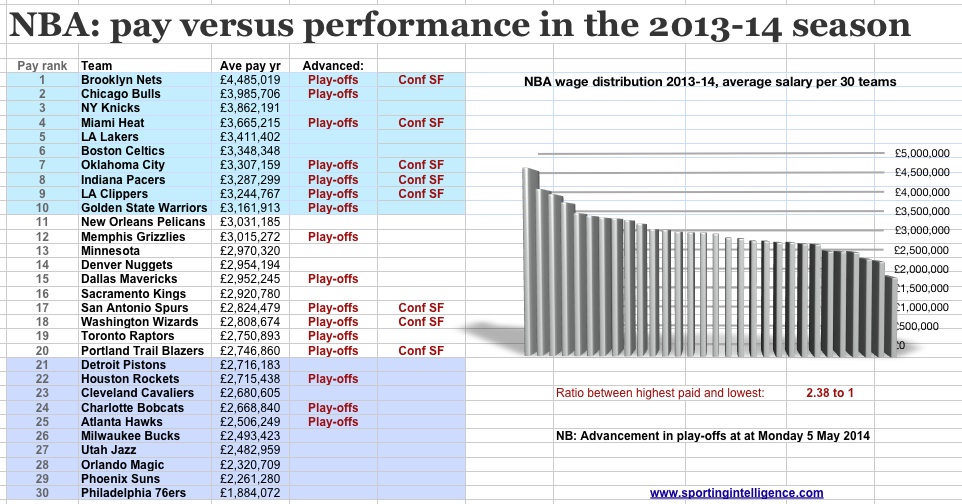
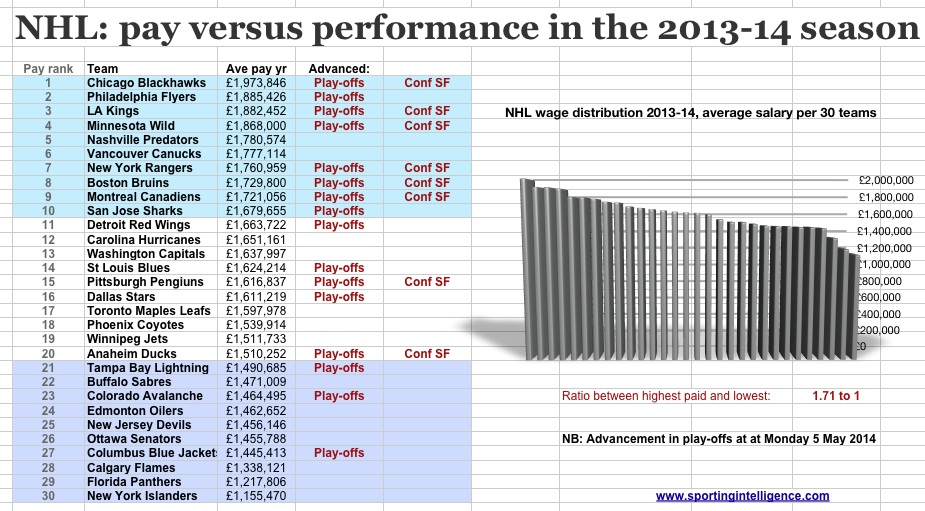
The situation for the NFL, NBA, NHL and MLB are summarised in graphic form below and are self-explanatory.
But a summary of the relationship is thus:
- In the NFL 2013 season ending in 2014 SuperBowl, six of the 10 best paid teams were among the 12 play-off teams, and only one of the ten worst-paid teams was there.
- Both the Super Bowl teams, the Seahawks and Broncos, were in the top four best-paid teams, the winning Seahawks at No2.
- In the NBA 2013-14 season (ongoing at the time of writing), seven of the 10 best paid teams were among the 16 play-off teams and only three of the 10 worst paid teams.
- At the NBA Conference semi-finals stage, five of the eight teams involved are among the 10 best paid teams, none are from the worst paid 10 teams.
- In the NHL 2013-14 season (ongoing at the time of writing), eight of the 10 best paid teams were among the 16 play-off teams and only three of the 10 worst paid teams.
- At the NHL Conference semi-finals stage, six of the eight teams involved are among the 10 best paid teams, none are from the worst paid 10 teams.
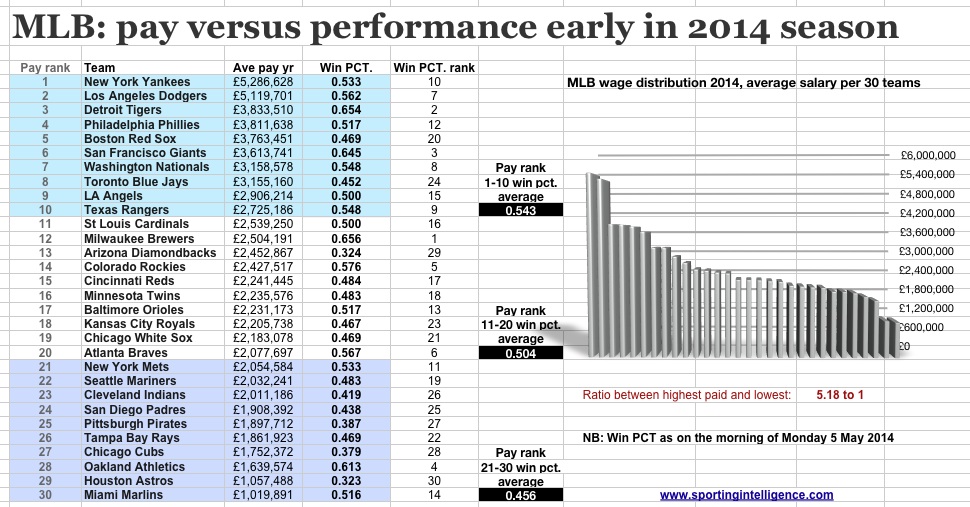
- The Major League Baseball season is only in its early stages, but already there are patterns of better results for better paid teams. Those ranked 1-10 in the pay rankings have an average win % of 0.543 (at the time of writing). Those 11-20 have an average win % of 0.504; and those ranked 21-30 have an average win % of 0.456.
Details at the foot of this article about how to obtain a free copy of the Global Salaries Report that forms the basis of this analysis.
Click to enlarge any of these graphics
.
.
Follow SPORTINGINTELLIGENCE on Twitter
Obtain the full Global Sports Salaries report (left) FREE by clicking this sentence to send an email. (Write GSSS 2014 in the subject line, and your name / organisation in the email)NB: reports are being emailed on an individual basis so please be patient if you don’t get it immediately
.
.
.
.