*
ARSENE Wenger has helped to transform English football, on and off the pitch, since his arrival at Arsenal from Japan in 1996. Silverware and plaudits followed but since 2005, when the ‘big money era’ of Roman Abramovich’s Chelsea and Sheikh Mansour’s Manchester City have led to increased competition in the Premier League, the Gunners have gone without a trophy. Has Wenger been under-achieving? Has he in fact been performing as well as resources dictate, or better? What are those resources? The Arsenal Supporters’ Trust asked Sportingintelligence to look at some of these issues, and that culminated in a presentation to Trust members in London on Monday. That piece of work is available in full as a free PDF download HERE. The main part of the work is published below, but all the supplementary materials are available in full here: Arsene Wenger – what is he good for?
By Nick Harris
24 October 2013
APART from helping to transform English domestic football culture, on and off the pitch, and delivering Arsenal fans two Doubles, an Invincibles season plus multiple domestic and European finals – what has Arsene Wenger ever done for Arsenal?
The research laid out in this article and in the supplementary material concludes:
FIRST: Consistently and with the rare exceptions of two seasons out of the 17 between 1996-97 and 2012-13, Wenger has produced teams that have either out-performed expectation on the pitch given the resources available to him off it, or at least met those expectations.
It is well established that he has not spent much, net, in the transfer market. This research shows, using official club accounts, that in the 17 seasons from 1996-97 to 2012-13 inclusive, Arsenal spent £444.5m on transfers, and received £341.3m, so spent £103.2m net in those 17 years.
BUT the research also shows that much of that net spending was laid out on agents’ fees and other ‘normal’ costs of deals, and the ‘real’ net spent over those 17 years was more like £23.4m. This is tiny compared to any of Arsenal’s main competitors.
Arguably more important, Wenger has very frequently out-performed Arsenal’s wage spend – and wages are a key determinant of success in elite football.
SECOND: Analysis suggests that Wenger’s worst ever Arsenal season, in terms of performing less well than finances should have dictated, was in 2005-06, when as well as finishing in the top four of the Premier League (again), he also took Arsenal to the final of the Champions League.
THIRD: That season, 2005-06, was the worst ever not just because Wenger had more to spend than key rivals yet finished behind them, but because Arsenal amassed the fewest points of any Wenger season (67), finished as low as any Wenger season (fourth), and had less ‘team stability’ than any other season of the Wenger era.
‘Team stability’ in this context considers how many Premier League starts, combined, Wenger gave to his “core” XI players in that season, whoever they were.
We have looked at every season of the Wenger reign and found the 2005-06 season to be the least ‘stable’, with only 64% of starting places going to “core” players. This is the lowest % of the Wenger years.
In the Invincibles season the comparative figure was as high as 83%, similar to the 1998-99 season when Arsenal lost the title by a point to another of the era’s best-ever teams, Manchester United’s Treble winners.
This ‘woeful’ 2005-06 season for Wenger, in which Arsenal took the lead in the Champions League final before losing 2-1 to Barcelona, is compounded in statistical terms by being one in which Arsenal spent more money in the financial year – £23.75m cash – on transfers than any Wenger season bar one up to that point, and also had more ins and outs for cash than any financial year before or since.
FOURTH: That perhaps Wenger is telling the truth when he speaks, often, about wanting value in the transfer market, and wanting to buy players when they are better than he already has. Because he knows, from that 2005-06 season, and from the following season and a few others, that all business is not necessarily good business. And too much business can have a negative impact on the team, if selection becomes too ‘unstable’, which we can show, in a general sense, for Arsenal and key rivals, is a bad thing.
FIFTH: Evidently there is some issue at play hindering Arsenal in recruitment. Whether this is the loss of key ally David Dein still being felt from 2007 – a view to which I still subscribe – is debatable. There are also those who argue that for all the huge cash balances of the past half dozen years, there really has not been as much money to spend as Arsenal have sometimes made out. Again this is debatable.
———————————————-
*
SO THE INTENTION of this exercise is to present some key basic facts and data to digest, in order to help you make up your own mind.
Do you fall into the camp that believes there are three ages of Wenger?
- The silverware years of 1998 to 2005.
- The ‘big money’ barren years when Chelsea and City as well as United have bought success.
- The renaissance years, just getting underway.
Or is Arsene Wenger a busted flush?
Let’s start with a financial analysis of transfer and wage spending in the 12 years from the Millennium to summer 2012, taking into account Arsenal and their key current ‘rivals’, who together comprise the so-called ‘Sky 6’ – so that’s Manchester United and Manchester City, Chelsea, Liverpool, Tottenham and Arsenal.
Why those six? Because they are relevant to now in a way that say, Newcastle United and Leeds, and to a lesser extent Aston Villa and Everton and other top-four challengers are no longer relevant. They are today’s ‘Big Six’.
And why 2000 to 2012? Pragmatically because the things we want to look at for six teams over 12 years fit into our first big graphic; but also because these years comprise the boom years of the second Double and Invincibles season, take in the ‘big money’ age of Abramovich and Mansour, the Arsenal ‘decline’ post-2005 and the emergence of the contemporary Arsenal, with its mixture of home-grown players, ‘home imports’ from other British clubs and growing financial power that allowed the purchase of Mesut Ozil, and quite possibly more big-money signings to come.
So what are we looking at?
1: Net transfer spend each season between 2000-01 and 2011-12, which means the difference between what each club spent in each of those seasons and what it received. If a club spent £10m in a year and received £10m, it had net expenditure of nothing. If it spent £20m and received £10m, it had net expenditure of £10m. If it spent £10m and received £20m, it had net income of £10m. How do we know how much each club spent? For the purpose of this exercise, we are using the official cash expenditure on transfers each financial year, according to official club accounts.
2: Wage expenditure. For this exercise, we are using the total wages spend by each club on all their employees each year, according to official club accounts. The biggest single expense of any football club is player wages. They account for (very, very, very roughly) about 70 per cent of all wages at a club, although this varies. So if a club’s total wage bill is £100m, then you might reasonably expect around £70m, give or take a few million, to be spent on player wages, as opposed to on managers, coaches, executives, cleaning staff, ticket office personnel, marketing people, stewards and all the rest combined.
3: This first graphic – which contains 306 separate pieces of information – also tells us where each club ranked in wage bill each season (1st, 2nd, 3rd etcetera) and where they finished in the league each season.
Article continues below. Click on the graphic to enlarge
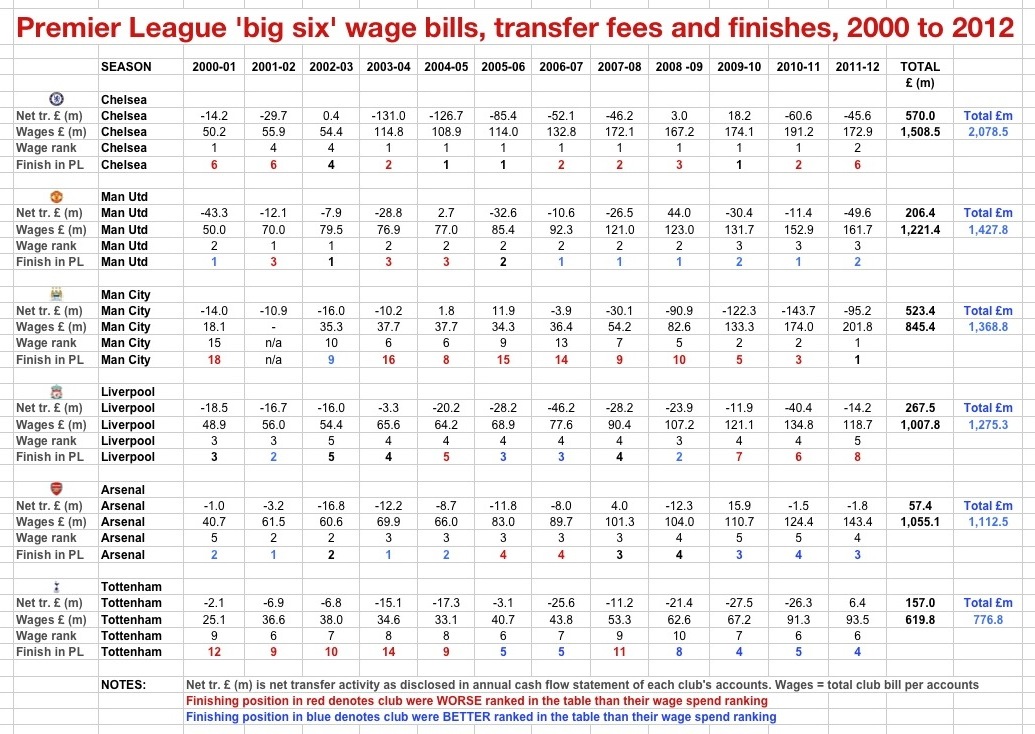
We are interested in wage expenditure particularly because of the strong link between wages and performance in the Premier League. This is a well established relationship as anyone who has read ‘Soccernomics’ will be aware. Over a period of time, clubs spending more on wages will, generally, do better in the Premier League than clubs spending less.
Sportingintelligence also contributed to a study in 2010 in association with the Wall Street Journal (link here) that found the relationship between wages and success to be around 85 per cent – ie: wage spending is 85 per cent responsible for finishing position. In the NFL, the same study showed it was 14%.
Anyone interested in a more detailed look at wages and success in the Premier League, or with insomnia, can see further articles on the same subject here, and here in an article that focused on an exception that proved the rule, QPR last season.
To massively simplify the theory that wages = success, it goes as follows: when you spend loads of money on wages, it’s because you’re getting great players, who will do better than less good players on less money.
It is very much an ‘all other things being equal’ theory.
The first graphic above showed: transfers, wages, wage rank and performance over 12 years for six teams. Elsewhere, in the season-by-season pages of the supplementary materials, you can see most of the individual permanent transfer deals by Arsenal in the period; loans not included.
The big six against each other
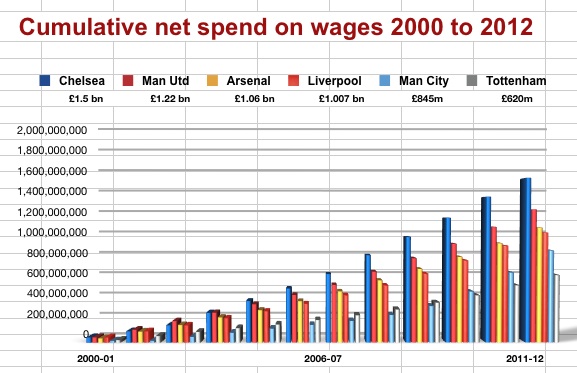
The graphic ranks the ‘big six’ in order of their total net spending on transfers plus wages combined over the 12 years in question.
Chelsea spent most, with £2.078 billion, then Man Utd on £1.43bn, then City with £1.4bn, then Liverpool with £1.3bn then Arsenal with £1.1bn and Spurs on £777 million.
The year-by-year spending on transfers and wages is self-evident and these next two graphics depict that spending visually. Arsenal’s net transfer spending is 1/10th of Chelsea’s, or £57m v £570m. Note that Arsenal’s net spend is for those 12 years; the total net spend for the 17 years, as mentioned earlier, is £103.2m, much of which wasn’t transfer fees at all, but related costs.
Article continues below
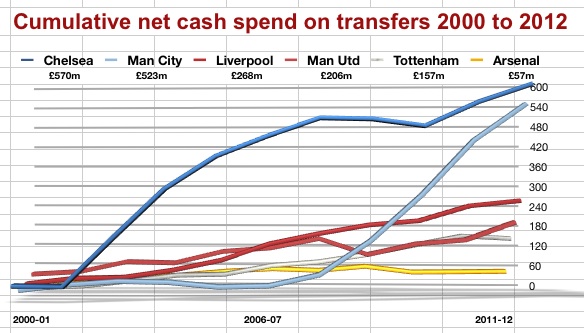 .
.
.
So how do the ‘Big 6’ compare when measuring (wage) resources versus achievement?
In the 12 years in question:
Chelsea did not do better than their resources in any year, under-performing against their wage bill eight times and doing only as well as expected four times.
United did better seven times, worse three times and as well as expected twice.
Manchester City performed better once: when finishing ninth in 2002-03 when wages said they should have finished 10th. They have otherwise under-performed apart from the title-winning season when they did as well as expected.
Liverpool did better than expected four times in the period, worse four times and as expected four times.
ARSENAL out-performed their wage spending seven times, did as well as expected three times, and under-performed in 2005-06 and 2006-07. We’ll come back to that – but it’s better than any rival.
Tottenham did better than their wage bill six times – and worse six times, in the period under review.
The first age of Wenger
That record shows that he:
1: Took Arsenal to third place, second but for goal difference, in his first (incomplete) season.
2: Did the Double in 1998.
3: PL Runners-up by a point in 1999.
4: PL Runners-up in 2000, when also runners-up in Uefa Cup
5: PL Runners-up in 2001, and FA Cup final
6: Double in 2002
7: PL runners-up in 2003 and FA Cup winners
8: Invincible PL winners in 2003-04 and two Cup semi-finals
9: PL runners-up and FA Cup winners in 2005
Vieira left in summer 2005, Arsenal moved to the Emirates in 2006 and David Dein left in 2007 in the wake of Stan Kroenke, who he introduced to the club, arriving as an shareholder.
The second age of Wenger
The post-2005 ‘down’ period: 4th in 2006 and Champions League finalists; 4th in 2007 and LC finalists; 3rd in 2008; 4th in 2009; 3rd in 2010; 4th in 2011, LC r-up and R16 loss to eventual CL winners Barca; 3rd in 2012; 4th in 2013 and CL loss to eventual winners Bayern.
Before we look at why Wenger may have been influenced not to spend a lot of money after 2006, because of what happened in 2005-06, let’s look in more detail at transfer spending, reports versus reality.
First, a graphic, explanation afterwards.
Article continues below. Click to enlarge
TRANSFER spending is a contentious issue at Arsenal precisely because there has been so much attention on whether Wenger has been free to spend.
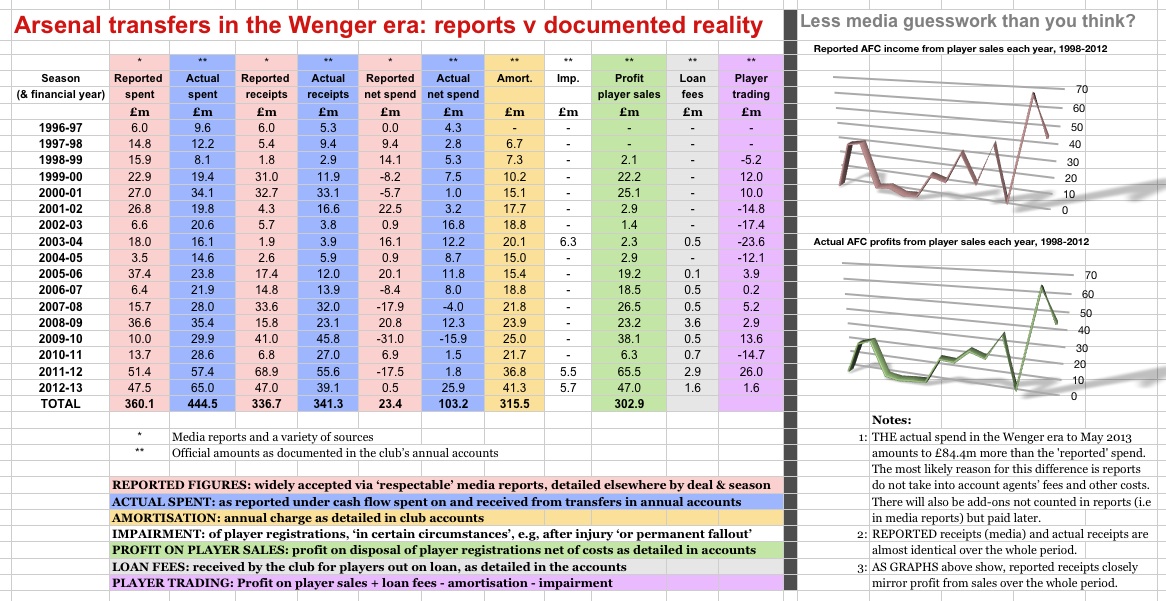
The graphic above contrasts a) spend by season as reported by the media and as detailed on a deal-by-deal basis in the supplementary material with b) the money going in and out of the club in cash on transfers each season as documented by the accounts.
The accounts show that cash spending on transfers in the Wenger era from 1996-97 to 2012-13 inclusive was £444.5m.
That was actual cash, out, detailed season by season in the graphic. It is also £84.5m more than the transfer spend that most people reading ‘respectable’ reports will expect to have been spent. As the detailed deals show, Arsenal have reportedly (according to the media) spent only £360.1m in that time.
When it comes to selling players, the real amount received according to the accounts, in cash, has been £341.3m, which is very close to the reported amount of £336.7m.
The reported net spend over the period is a tiny £23.4m, while the actual net spend is £103.2m – and the difference almost certainly lies primarily in unreported parts of deals when buying players, namely agents fees, and then subsequent payments in add-ons later, not initially reported.
Why do we think this? Two reasons. First, because of the amortisation figures: £315.5m for the Wenger era.
Amortisation is a ‘book’ figure that spreads the total cost of buying a player across the term of that player’s contract. So that’s the transfer fee plus any agent’s fees, plus signing-on or other costs. If a player joins for £10m on a four-year deal, and let’s add £2m more in agent fees and signing-on costs for £12m total, it will be ‘amortised’ through the books at £3m a year over four years. When players renegotiate their contracts to extend them, the amorisation cost is ‘re-set’.
So if the player, after two years, signs a two-year extension, the club will have only £6m of his original fee left to amortise, also over four years (the original two remaining plus the new two), and the charge for him will reduce from £3m a year to £1.5m a year. In this way, the amortisation charges up to any one point will not wholly reflect the money spent – there will be tens of millions pounds remaining unamortised; effectively if not exactly the difference between actual cash spent and the amortisation figure.
Our second ‘check’ that reported figures are generally accurate comes when we compare those numbers to profits on player sales as detailed in the club accounts. The two columns ‘reported receipts’ and ‘profit on player sales’ on the graphic above, depicted in the graphs on the right-hand side, closely if not exactly mirror each other. The profit on player sales is slightly less over 17 years combined (£302.9m) than the reported receipts but this simply means that not all the receipts have been profit – just most of them. This of course demonstrates that Arsene Wenger has, over a long period of time, kept his net spending on players (fees aside) down to a minimum.
Whether or not he should have to done so, of course, is an entirely different matter.
Before we consider that question, we’ll quickly have a detour to why, when everything is taken into account, that 2005-06 season was Wenger’s worst.
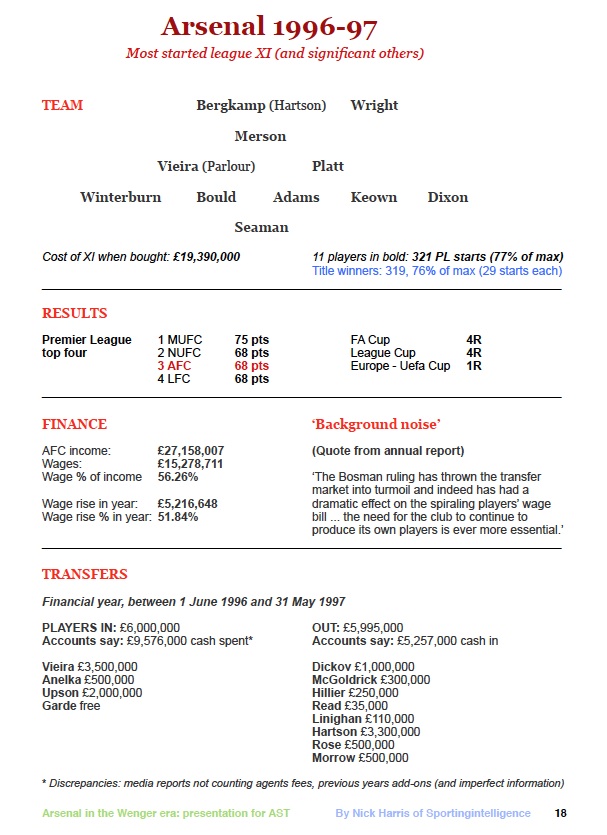 On each of the season-by-season pages (they’re in this download, and each one looks like the example on the left from 1996-97), there is a team of players started most often that season in the Premier League by Wenger.
Why the League? Because it is the bread and butter competition, the first priority, the staple of the season.
Why starts? Because over the whole season it will reflect the most important players.
The teams as laid out are therefore not meant to suggest, always, that Wenger played that formation or those exact players in that place on the pitch, and certainly not that the 11 main players in each formation were played together in that formation every week, although in many weeks they may have been.
The layouts simply show a ‘core’ XI who started the most league games.
The only times these 11 players were not the 11 most used is when, for example, a key role would have gone uncovered by using that 11.
In 2001-02 for example, none of Arsenal’s goalkeepers reached 20 league starts, but 11 outfielders did. But David Seaman, with 17 starts (with Wright making 12, and Taylor nine) gets into that season’s most-used XI.
The ‘stability’ number for each season is calculated by working out how many starts the core XI players made each season, and working out what percentage of the ‘perfect’ 418 (or 38 games times 11 starting places) they added up to.
The season-by-season pages show you stability number for every Arsenal season, and also the stability number for the champions each season when that wasn’t Arsenal. The title winners are at around 70% in most seasons, if not all, and often a lot higher.
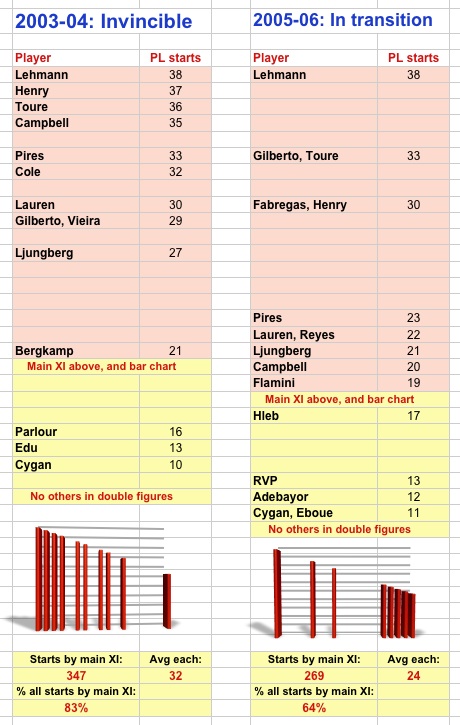
The next graphic illustrates contrasting Arsenal seasons, Invincible versus ‘In Transition’.
The stability in the Invincible season was 83%, and in 2005-06 it was 64%.
That equates to each of the core XI playing an average of 32 league games each (of 38) in the Invincible season, but 24 each in the 2005-06 season.
Small margins matter in elite sport, and that is some gap.
I’m sure some Arsenal fans will be wondering what these season’s stability number is sitting at. Up to an including last Saturday’s thrashing of Norwich, it was at 82 per cent.
SO WHERE has Wenger gone wrong? Arguably that 2005-06 season indicates signing too many players – and having too many players moving in and out in one season – was a bad idea. Whether this is also his own private assessment, only he will know. Of course there have been misses on transfers along with many hits, and it doesn’t require a non-Arsenal fan to list some of those.
The trophy-less years have also coincided, of course, with the advent of the ‘big money’ from Chelsea and Man City. Abramovich’s first season of ownership in 2003-04 was transitional for them but by 2004-05 and 2005-06 they had spent massive sums on new players and wages; and Manchester United in turn responded to that before Sheikh Mansour arrived at Man City in 2008 and started his own spending.
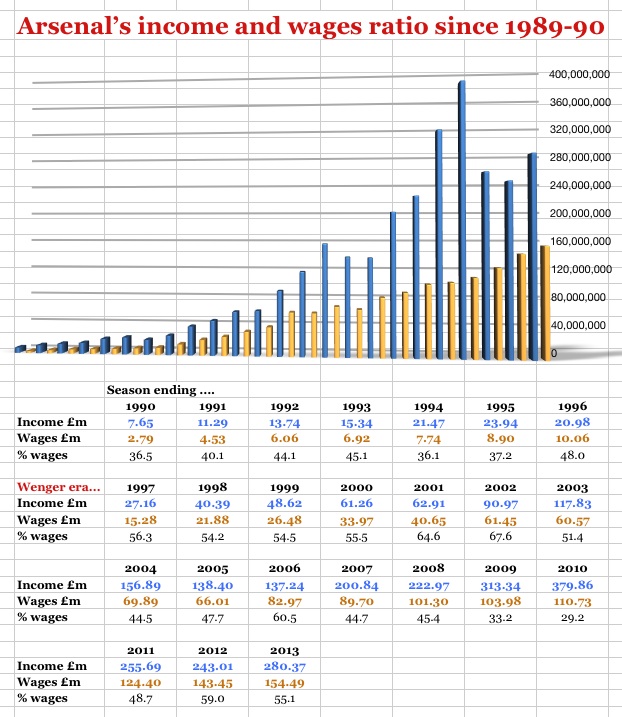
The last time Arsenal’s wage spending was even as high as third in the Premier League was 2007-08, and they finished third. Since then it’s been fourth or fifth and Arsenal have performed as well or better each season. Wage inflation has been enormous across the league, of course, as this next graphic shows in detail for Arsenal.
Look at the wage bill in 1989-90 (£2.79m or 36.5% of income), and then look at 2012-13: £154.49m or 55.1% of income.
NOTE: ‘Freaky’ high income in a few seasons of stadium development, years ending 2009 and 2010 especially, from property sales income, does not reflect football income alone those years.
The continuing ascent of the wage bill, from £2.79m to £154.49m, or up by more than 5,400% between 1990 and 2013, does reflect football inflation of the Premier League years.
Article continues below. Click to enlarge graphic
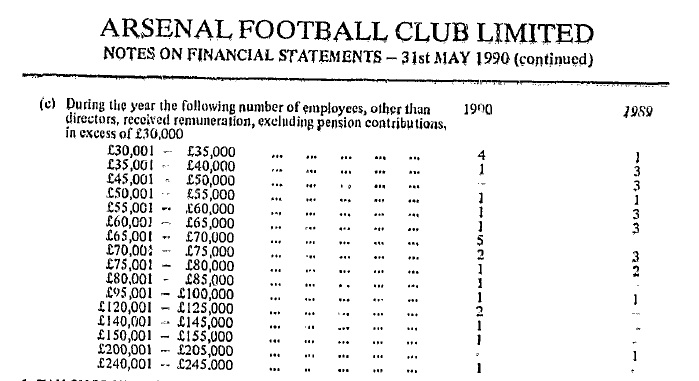
As a blast from the past, a snapshot of a bygone and more transparent era, here is a more detailed breakdown of Arsenal’s wage bill from 1989-90 as listed in the accounts. It was the last time they provided such detail.
Article continues below. Click to enlarge graphic
Back to the current Arsenal, and the search for a first trophy since 2005, Arsenal insist that they are now ready to combat the ‘big money’ of their main rivals with their own big money. Ivan Gazidis has been saying this with some fervour for some months now; and the summer deal for Ozil did demonstrate that the cash was in fact there to be spent. And I’m sure there is more, certainly tens of millions more for January, if the right players are available.
Wenger has been notoriously reluctant to spend. These ‘interim years’, the post-Vieira, post-Dein, new stadium and new owner years have, for those and other reasons, have contributed to the lack of spending. Finding the right replacements, doing the right deals, staying within comfortable financial limits and coping with the in-fighting of the boardroom have all undoubtedly contributed to lack of ‘significant’ activity before Ozil.
Not getting Suarez or Rooney or Higuain or Lars Bender or whoever was not lack of money but lack of pre-planning or availability, I would argue.
What about cash? It’s been there for some years.
The cash pile at the end of 2012-13 was £153.5m; 11-12 was higher, £153.6m; 10-11 was £160.2m; 09-10 was £127.6m; 08-09 was £99.6m; 07-08 was £93.3m; and 06-07 was £73.9m with £35.6m and £71.6m the two years before.
How much is there to spend?
Tens of millions. The Arsenal Supporters’ Trust’s own analysis of the most recent accounts concludes some £50m should be available for Wenger in January for players – if he wants it.
Not all of the £153.5m that was there in May was available, because around £30m needs to be kept in the debt service reserve account. A chunk of the rest is season ticket income, and I know the AST have put this as high as £65m a year ago, calculating therefore a ‘usable’ balance of £46m a year ago.
Arsenal could safely spend a few tens of millions in January, and as much again and more next summer, even if you err on the side of caution.
But Wenger is cautious; we know that.
The wage bill can soon balloon when you decide to pay £200,000 per week, or £10.4m a year plus national insurance and pension and other costs.
A squad of players, even only 25 of them, costing £11m each per year, is an utterly unfeasible £275m.
That’s without dozens of other young pros, a manager, coaching staff and all other employees.
Ridiculous? Don’t think there won’t be pressures for pay rises once a player or a few are way ahead of the rest.
Until now, Wenger has also been good for equality in the dressing room. I’m sure he still is.
It’s been one of the many reasons Arsenal should be thankful for him. Debatably.
More stories on Sportingintelligence that mention Arsenal
REVEALED: The best paid teams in global sport
From £200m Messi to £20m Lukaku: Europe’s 60 most valuable players this summer
Follow SPORTINGINTELLIGENCE on Twitter