- 0
By Nick Harris
SJA internet Sports Writer of the Year
20 March 2011
.
Money talks in football, with reams of evidence that the more you spend on wages, the better you perform.
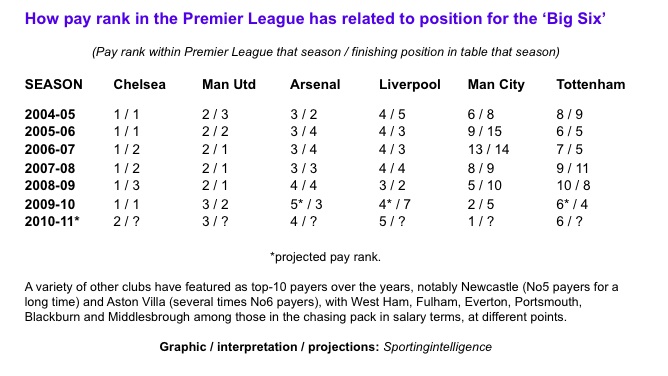
That’s why, using soccernomics theory, Manchester City and Chelsea, who meet on Sunday at Stamford Bridge, should be vying with each other for the title this season, rather than trying merely to stay inside the top four.
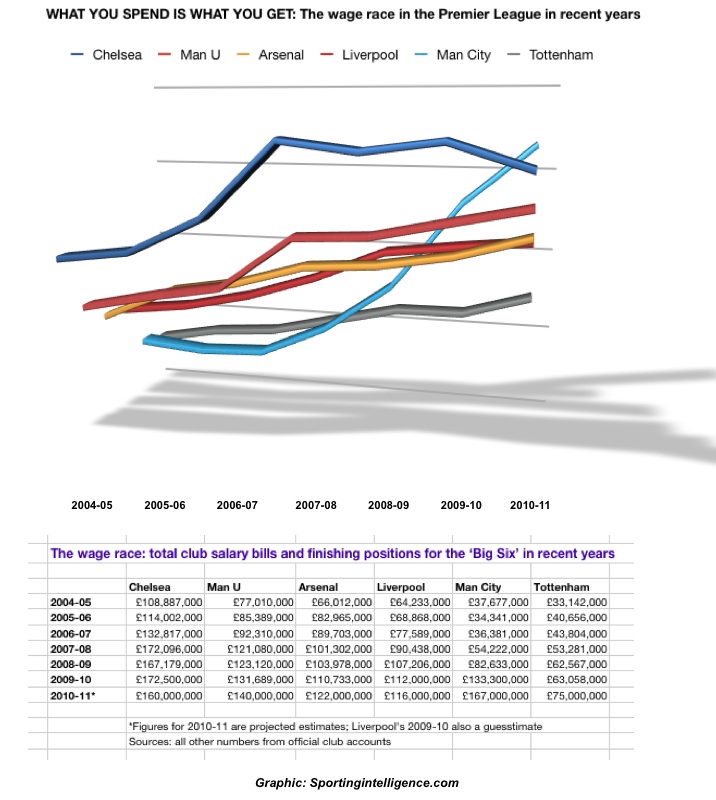
City’s wage bill, for the first time, is on course this season to be the biggest in the Premier League. In 2009-10, it was £133m for all staff and is expected to climb this season to around £165m, give or take a few million. Bonuses (or not) will alter that total.
Over at Chelsea, the total club bill for 2009-10 was £172m including bonuses for the Double, but with squad cuts last summer, it will fall, probably closer to £160m for 2010-11. Again, bonuses (or not) will change things.
What is certain is that City and Chelsea will be the No1 and No2 payers in the Premier League this season, as will be verified when the numbers become available late in 2011 or early next year.
So City should, economically speaking, be making a serious tilt for this season’s Premier League. Chelsea are in their eighth season of Abramovich patronage and were title winners from season two. City are in their third season of Mansour patronage.
As our first table shows, there is a strong relationship between wage bills and success. In essence, the biggest spenders win or challenge and those who spend least go down.
.
(NB: The wage bills used in the graphic here and the one below are total club wage bills, to keep the analysis simple. My personal view is that an ‘average salary per first-team player’ is an even more accurate predictor, not just in football but NBA basketball, NHL hockey, MLB baseball and other leagues, but that’s a more complex argument for another day soon).
Salary levels in Premier League football are around 90 per cent responsible for finishing position, according to Stefan Szymanski, the co-author of ‘Soccernomics’, and a professor of Economics and the Director of Sports at the Cass Business School in London.
Today’s game is a clash of £1.4bn in combined expenditure in billionaire’s cash to date, according to sportingintelligence calculations.
For Chelsea, we reckon Roman Abramovich has spent £773.9m and counting so far at Chelsea since 2003, give or take a few tens of millions. This figure comes from £140m for equity and debt in summer 2003, plus picking up the tab for successive annual losses since then of £87.8m (in 2003-04), £140m, £80m, £74.8m, £66m, £44.4m, £70.9m (in 2009-10) and a projected conservative loss of £50m in 2010-11.
At City, we reckon that Sheikh Mansour has so far spent £648.8m and counting since September 2008, made up of initial equity and debt payments of £304.9m, annual losses of £92.6m in 2008-09 and £121.3m in 2009-10, and a projected loss for 2010-11 of around £130m.
If these figures make the head swim, then the net result should be simple: spending that much cash really should put you in contention for the title.
As Prof Szymanski explains to sportingintelligence: ‘It’s reasonable to be able to predict performance in football by wages because, in simple terms, there is a market in players and the best players will end up with the clubs who can pay them the most money.’
Transfer spending is another related indicator of potential success – but not quite as good for several reasons. Fees are often more arbitrary, or not paid at all in the case of ‘Bosman’ deals. Pressure to splash out on fees in time-limited windows also tends to distort matters in a way that long-term wage deals tend not to be distorted. There is a vibrant debate over whether wages or fees are definitive; the mundane truth is that an as-yet undefined combination of both would probably be best.
Symanski says: ‘We have evidence over a long period showing the relationship between wages and success, and transfer fees don’t track success quite so closely.’
He added that the relationship between pay and success is best observed over long periods. One club consistently spending the most on wages over time will almost certainly becoming high achieving consistently, as Chelsea have done.
‘If City are the biggest spenders over the next decade, we’d expect them to win more titles than anyone else in that period,’ Symanski says. ‘We wouldn’t necessarily expect the impact in Year One [of investment, 2008-09] but already we’ve seen them move from mid-table to Champions League [aspirants], and now they’re in there, they can compete for the title . . . that’s what you expect when you spend money.’
Our second graphic today charts the total salary spending of the ‘Big Six’ – Chelsea, Manchester United, Arsenal, Liverpool, City and Tottenham – since 2004-05.
Chelsea in dark blue have consistently outspent their rivals on wages in that period – until now, perhaps. Note City’s light blue rise.
.
More on City / Chelsea / United / Arsenal / Liverpool / Tottenham


